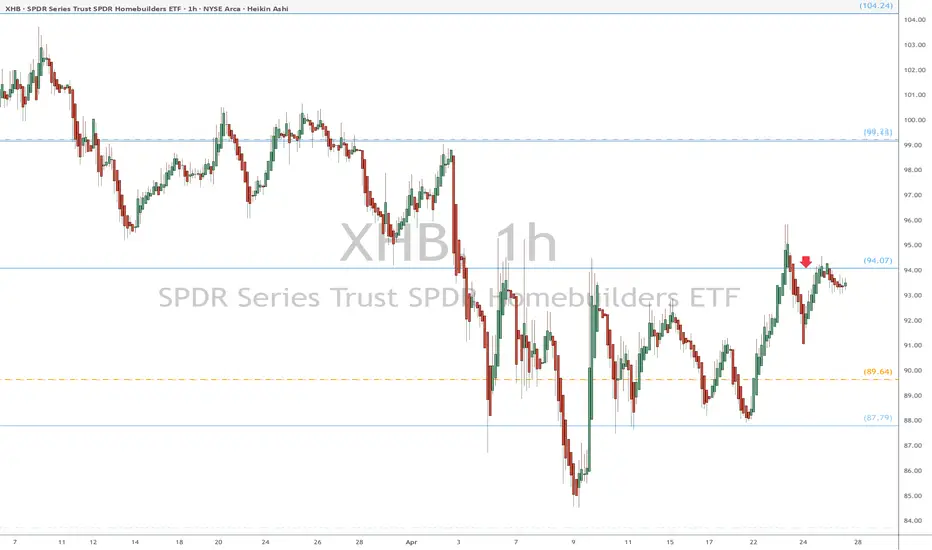
XHB eyes on $94.07: Semi-Major Genesis fib trying to End Bounce XHB trying to recover after good Housing reports.
Currently testing a Semi-Major Genesis fib at $94.07
Look for a dip or a Break-and-Retest to take entries.
Key stats
About SPDR SERIES TRUST SPDR S&P HOMEBUILDERS ETF
Home page
Inception date
Jan 31, 2006
Structure
Open-Ended Fund
Replication method
Physical
Dividend treatment
Distributes
Distribution tax treatment
Qualified dividends
Income tax type
Capital Gains
Max ST capital gains rate
39.60%
Max LT capital gains rate
20.00%
Primary advisor
SSgA Funds Management, Inc.
Distributor
State Street Corp. (Fund Distributor)
XHB provides quirky and diffused exposure to homebuilders. It selects US firms by market-cap, then equally weights its components--an approach that results in a portfolio that tilts away from companies that dominate the industry. The fund reaches well beyond industry bounds by our lights: Most holdings land outside the homebuilding category. While XHB doubtlessly provides more diversification, investors looking for hefty stakes in leading names won`t find them here. Index rebalancing occurs quarterly.
Related funds
Classification
What's in the fund
Exposure type
Consumer Durables
Producer Manufacturing
Retail Trade
Stock breakdown by region
Top 10 holdings
$XHB - ShortSimilar to AMEX:SRS which is a short against real estate, AMEX:XHB is the home builders index. We again see a revesal candle into the prior qrtrs mother bar, if it closes inside the mother bar, a strong top signal is created.

Home building Will it continue or start decliningThis could be a leading indicator for what is to come. Let's keep an eye on it.
We do have a bearish divergence on the monthly RSI. It also is happening on the weekly as well.
It is to early to tell what direction it will go. We should expect a strong bounce from here and see where it goes.
Best

Shorting Homebuilders ETFIf you look at the Building Permits Leading Indicator, new permits have been decreasing since January 2022. Housing Starts will confirm the same... New Home Sales have decreased since 2020... Building Permits usually lead Housing Completion by 8-16 months...
Additionally Interest Rates have nearly


XHB short 83.80Look daily stoch
Look vol lots selling
Weekly not looking good
Housing and commercial real estate going collapse here and china

US Home Builders to hold 200-day moving average.XHB may come down to the 200-day simple moving average (yellow line) and wick below but I think the next 8W candle will be green.
I think market sentiment is overly negative. Expectations for inflation is as high as in Q4 2022 when inflation was very high in the US. If the interest rates, go up fur

Macro Monday 3 - SPDR Homebuilders XHBMacro Monday
SPDR Home builders ETF (XHB)
This equal weighted index tracks 35 holdings of the homebuilders segment of the S&P Total Market Index (TMI) and is spread across large, mid and small cap stocks.
These comprise of the Homebuilding sub-industry, and may include exposure to the Building Pr

XHB on a bullish move. Will this signal homebuyer confidence?I wanted to touch base on the Homebuilders ETF, which I analyzed back on Jan 20, 2023
On jan 20, price broke out of its side-ways range finding support on the VAH and at the time of writing, testing the weekly of 69.65 as support.
Based on my Fib time levels, I am expecting a significant move aro

XHB H2 2023, 3d chartWatch XHB here.
Reaching recent top, and looking too weak for much higher, if at all.
That 77 pivot needs to be retested soon. Liquidity is to the downside.
HD reports this week and will set the tone for this etf coming up.

See all ideas
Summarizing what the indicators are suggesting.
Oscillators
Neutral
SellBuy
Strong sellStrong buy
Strong sellSellNeutralBuyStrong buy
Oscillators
Neutral
SellBuy
Strong sellStrong buy
Strong sellSellNeutralBuyStrong buy
Summary
Neutral
SellBuy
Strong sellStrong buy
Strong sellSellNeutralBuyStrong buy
Summary
Neutral
SellBuy
Strong sellStrong buy
Strong sellSellNeutralBuyStrong buy
Summary
Neutral
SellBuy
Strong sellStrong buy
Strong sellSellNeutralBuyStrong buy
Moving Averages
Neutral
SellBuy
Strong sellStrong buy
Strong sellSellNeutralBuyStrong buy
Moving Averages
Neutral
SellBuy
Strong sellStrong buy
Strong sellSellNeutralBuyStrong buy
Displays a symbol's price movements over previous years to identify recurring trends.
Frequently Asked Questions
An exchange-traded fund (ETF) is a collection of assets (stocks, bonds, commodities, etc.) that track an underlying index and can be bought on an exchange like individual stocks.
XHB trades at 1,777.000 MXN today, its price has fallen −8.29% in the past 24 hours. Track more dynamics on XHB price chart.
XHB net asset value is 1,847.90 today — it's fallen 9.66% over the past month. NAV represents the total value of the fund's assets less liabilities and serves as a gauge of the fund's performance.
XHB assets under management is 25.11 B MXN. AUM is an important metric as it reflects the fund's size and can serve as a gauge of how successful the fund is in attracting investors, which, in its turn, can influence decision-making.
XHB price has fallen by −8.29% over the last month, and its yearly performance shows a −2.90% decrease. See more dynamics on XHB price chart.
NAV returns, another gauge of an ETF dynamics, have fallen by −9.66% over the last month, showed a −7.73% decrease in three-month performance and has decreased by −8.72% in a year.
NAV returns, another gauge of an ETF dynamics, have fallen by −9.66% over the last month, showed a −7.73% decrease in three-month performance and has decreased by −8.72% in a year.
Since ETFs work like an individual stock, they can be bought and sold on exchanges (e.g. NASDAQ, NYSE, EURONEXT). As it happens with stocks, you need to select a brokerage to access trading. Explore our list of available brokers to find the one to help execute your strategies. Don't forget to do your research before getting to trading. Explore ETFs metrics in our ETF screener to find a reliable opportunity.
XHB invests in stocks. See more details in our Analysis section.
XHB expense ratio is 0.35%. It's an important metric for helping traders understand the fund's operating costs relative to assets and how expensive it would be to hold the fund.
No, XHB isn't leveraged, meaning it doesn't use borrowings or financial derivatives to magnify the performance of the underlying assets or index it follows.
In some ways, ETFs are safe investments, but in a broader sense, they're not safer than any other asset, so it's crucial to analyze a fund before investing. But if your research gives a vague answer, you can always refer to technical analysis.
Today, XHB technical analysis shows the strong sell rating and its 1-week rating is sell. Since market conditions are prone to changes, it's worth looking a bit further into the future — according to the 1-month rating XHB shows the neutral signal. See more of XHB technicals for a more comprehensive analysis.
Today, XHB technical analysis shows the strong sell rating and its 1-week rating is sell. Since market conditions are prone to changes, it's worth looking a bit further into the future — according to the 1-month rating XHB shows the neutral signal. See more of XHB technicals for a more comprehensive analysis.
Yes, XHB pays dividends to its holders with the dividend yield of 0.78%.
XHB trades at a premium (0.68%).
Premium/discount to NAV expresses the difference between the ETF’s price and its NAV value. A positive percentage indicates a premium, meaning the ETF trades at a higher price than the calculated NAV. Conversely, a negative percentage indicates a discount, suggesting the ETF trades at a lower price than NAV.
Premium/discount to NAV expresses the difference between the ETF’s price and its NAV value. A positive percentage indicates a premium, meaning the ETF trades at a higher price than the calculated NAV. Conversely, a negative percentage indicates a discount, suggesting the ETF trades at a lower price than NAV.
XHB shares are issued by State Street Corp.
XHB follows the S&P Homebuilders Select Industry. ETFs usually track some benchmark seeking to replicate its performance and guide asset selection and objectives.
The fund started trading on Jan 31, 2006.
The fund's management style is passive, meaning it's aiming to replicate the performance of the underlying index by holding assets in the same proportions as the index. The goal is to match the index's returns.