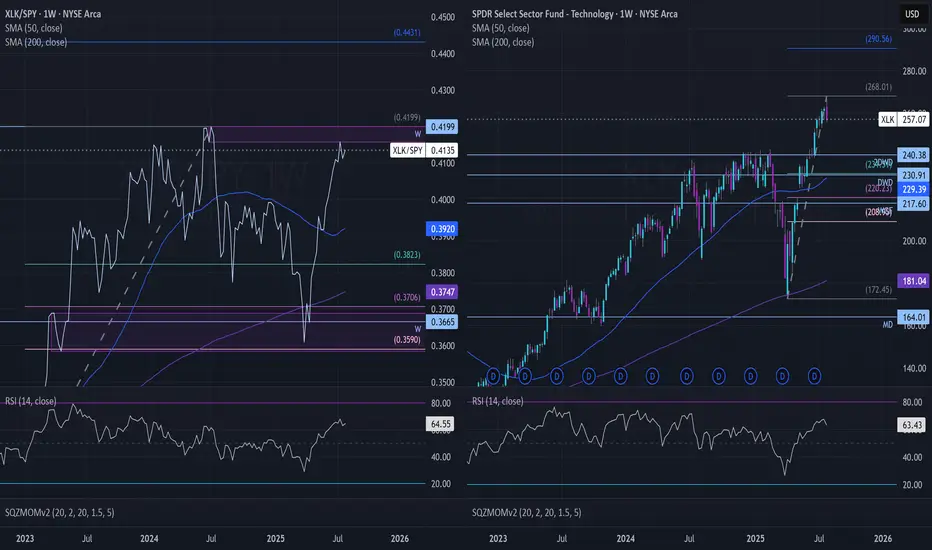
XLK Relative Strength – Leaders Extended, Rotation Risk BuildingXLK has been one of, if not the strongest sectors on a relative basis since bottoming at the end of March. Despite its relative strength, top SXLK holdings are into areas where profit-taking looks to be occurring, and a rotation out may be taking place (see Weekly Supply zone on RS chart 0.4157-0.41
Key stats
About SELECT SECTOR SPDR TRUST TECHNOLOGY SELECT SECTOR USD DIS
Home page
Inception date
Dec 16, 1998
Structure
Open-Ended Fund
Replication method
Physical
Dividend treatment
Distributes
Distribution tax treatment
Qualified dividends
Income tax type
Capital Gains
Max ST capital gains rate
39.60%
Max LT capital gains rate
20.00%
Primary advisor
SSgA Funds Management, Inc.
Distributor
ALPS Distributors, Inc.
XLK was the first to launch in this space, as such it offers a more narrow focus on the US technology segment. Its S&P 500-only portfolio tilts away from our segment benchmark. XLK is heavily concentrated and also a few that seem like misfits, such as financial payment processers or telecom firms. Its limited selection universe excludes small-caps and most midcaps. Avoiding smaller, less-stable firms results in lower volatility and a tilt toward value compared to our broad tech-industry benchmark index, and can cause other minor performance differences. XLK held the title for a long time as the cheapest and the largest fund in its segment.
Related funds
Classification
What's in the fund
Exposure type
Electronic Technology
Technology Services
Stock breakdown by region
Top 10 holdings
XLK ETF. TO WAR, OR NOT TO WAR — THAT IS THE QUESTION..US stock futures edged lower Wednesday evening ahead of Thursday’s market closure for Juneteenth.
The moves came after the Federal Reserve held interest rates steady, with Chair Jerome Powell striking a cautious tone amid rising geopolitical and economic uncertainty.
Powell reaffirmed a data-depen

Technology ETF Flirts with New HighsTechnology stocks have been coming to life recently, and some traders may expect new highs soon.
The first pattern on today’s chart of the SPDR Select Sector Technology Fund is last July’s peak around $238. As the fund retreated from that level, it began a period of underperformance. (See ratio cha

XLK Breaks All-Time High – Will It Stick the Landing or Soar?AMEX:XLK just broke into new all-time high (ATH) territory — barely — but the move is worth watching.
The breakout came on the heels of a strong bullish candle in the first week of June, followed by a doji last week, and now we're seeing fresh bullish momentum early this week with a gap-up.
➜ The

XLK/SPY above the 200 WeekXLK/SPY has crossed above the 200 week moving average, secular bull market of tech is back? Might be time to get long tech to not miss the rally if it happens. Tight stop whenever tech loses its 200 week on the ratio.

Bearish XLK: has been underperforming for a while now......made a rounding top starting December, trapped the bulls on a 3-day bullish island reversal in January. Ended up in the middle of July '24 gap down.
Negative YTD, under the VWAP from the top. It was never about NVDIA or DeepSeek news.

Indices quant zones, expression can be through nasdaq 100already have slight bull flow
in the event of a flush on market opens,
look for momentum slow and buy around these zones
expression can be through nasdaq 100
Check out our socials for some nice insights.
Let us know if there're any pair you like to see or if this is something you like.
Do ask

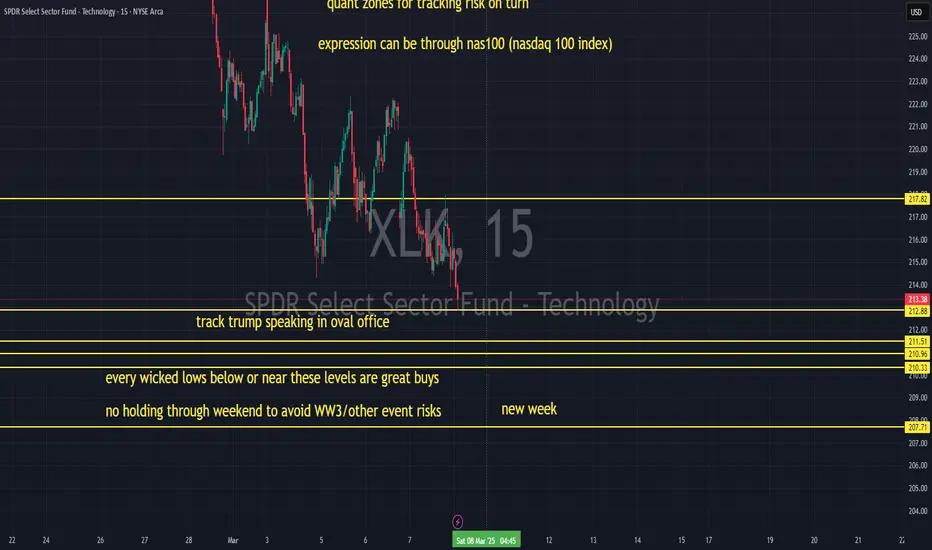
quant zones for tracking risk on turnevery wicked lows below or near these levels are great buys
no holding through weekend to avoid WW3/other event risks
expression can be through nas100 (nasdaq 100 index)
track trump speaking in oval office
momentum still strong. wait for momentum dissipation
quant zones for tracking risk on tu
Techonology relative strenght does not look promisingAMEX:XLK XLK has been lagging and the Relative Picture agains SP:SPX does not look promising. The triangle-like pattern is not good for the sector that has been the fuel for the stock market.
Not a short view yet for me, but a cautious one.

Tech stocks looking tired, more downside probableSince having reached the area near the all time high, the ratio of XLK/SPY has been in a pullback.
It looks like this might continue until we reach the bottom of the uptrend channel from where it could resume its uptrend to complet its 5th wave higher.
MACD and RSI are showing serious bearish div

See all ideas
Summarizing what the indicators are suggesting.
Oscillators
Neutral
SellBuy
Strong sellStrong buy
Strong sellSellNeutralBuyStrong buy
Oscillators
Neutral
SellBuy
Strong sellStrong buy
Strong sellSellNeutralBuyStrong buy
Summary
Neutral
SellBuy
Strong sellStrong buy
Strong sellSellNeutralBuyStrong buy
Summary
Neutral
SellBuy
Strong sellStrong buy
Strong sellSellNeutralBuyStrong buy
Summary
Neutral
SellBuy
Strong sellStrong buy
Strong sellSellNeutralBuyStrong buy
Moving Averages
Neutral
SellBuy
Strong sellStrong buy
Strong sellSellNeutralBuyStrong buy
Moving Averages
Neutral
SellBuy
Strong sellStrong buy
Strong sellSellNeutralBuyStrong buy
Displays a symbol's price movements over previous years to identify recurring trends.
Frequently Asked Questions
An exchange-traded fund (ETF) is a collection of assets (stocks, bonds, commodities, etc.) that track an underlying index and can be bought on an exchange like individual stocks.
XLK trades at 4,946.630 MXN today, its price has risen 1.72% in the past 24 hours. Track more dynamics on XLK price chart.
XLK net asset value is 4,970.54 today — it's risen 3.65% over the past month. NAV represents the total value of the fund's assets less liabilities and serves as a gauge of the fund's performance.
XLK assets under management is 1.56 T MXN. AUM is an important metric as it reflects the fund's size and can serve as a gauge of how successful the fund is in attracting investors, which, in its turn, can influence decision-making.
XLK price has risen by 4.58% over the last month, and its yearly performance shows a 27.89% increase. See more dynamics on XLK price chart.
NAV returns, another gauge of an ETF dynamics, have risen by 3.65% over the last month, showed a 17.30% increase in three-month performance and has increased by 27.34% in a year.
NAV returns, another gauge of an ETF dynamics, have risen by 3.65% over the last month, showed a 17.30% increase in three-month performance and has increased by 27.34% in a year.
XLK fund flows account for 37.65 B MXN (1 year). Many traders use this metric to get insight into investors' sentiment and evaluate whether it's time to buy or sell the fund.
Since ETFs work like an individual stock, they can be bought and sold on exchanges (e.g. NASDAQ, NYSE, EURONEXT). As it happens with stocks, you need to select a brokerage to access trading. Explore our list of available brokers to find the one to help execute your strategies. Don't forget to do your research before getting to trading. Explore ETFs metrics in our ETF screener to find a reliable opportunity.
XLK invests in stocks. See more details in our Analysis section.
XLK expense ratio is 0.09%. It's an important metric for helping traders understand the fund's operating costs relative to assets and how expensive it would be to hold the fund.
No, XLK isn't leveraged, meaning it doesn't use borrowings or financial derivatives to magnify the performance of the underlying assets or index it follows.
In some ways, ETFs are safe investments, but in a broader sense, they're not safer than any other asset, so it's crucial to analyze a fund before investing. But if your research gives a vague answer, you can always refer to technical analysis.
Today, XLK technical analysis shows the buy rating and its 1-week rating is buy. Since market conditions are prone to changes, it's worth looking a bit further into the future — according to the 1-month rating XLK shows the buy signal. See more of XLK technicals for a more comprehensive analysis.
Today, XLK technical analysis shows the buy rating and its 1-week rating is buy. Since market conditions are prone to changes, it's worth looking a bit further into the future — according to the 1-month rating XLK shows the buy signal. See more of XLK technicals for a more comprehensive analysis.
Yes, XLK pays dividends to its holders with the dividend yield of 0.61%.
XLK trades at a premium (0.48%).
Premium/discount to NAV expresses the difference between the ETF’s price and its NAV value. A positive percentage indicates a premium, meaning the ETF trades at a higher price than the calculated NAV. Conversely, a negative percentage indicates a discount, suggesting the ETF trades at a lower price than NAV.
Premium/discount to NAV expresses the difference between the ETF’s price and its NAV value. A positive percentage indicates a premium, meaning the ETF trades at a higher price than the calculated NAV. Conversely, a negative percentage indicates a discount, suggesting the ETF trades at a lower price than NAV.
XLK shares are issued by State Street Corp.
XLK follows the S&P Technology Select Sector. ETFs usually track some benchmark seeking to replicate its performance and guide asset selection and objectives.
The fund started trading on Dec 16, 1998.
The fund's management style is passive, meaning it's aiming to replicate the performance of the underlying index by holding assets in the same proportions as the index. The goal is to match the index's returns.