Strong Sell Opportunity on Exxon Mobil Corporation Hello,
We've identified a huge current opportunity to Sell Exxon Mobil Corporation with a high probability and a favorable risk-reward ratio of over 2 in the weekly chart.
Our target is $100 within a few Weeks
Ibrouri
XOM trade ideas

XOM downsidelooking to take this short depending on where it opens tuesday. alot of empty space to the downside

XOM - Higher prices on the horizon, aggressive traders can buyXOM appears to be trading in the 5th wave of a five-wave advance. The 4th wave looks over at 114.10 after having retraced 38.2% of the previous 3rd wave. We can buy here, with a stop below the aforementioned support targeting at least 123.75. For conservative traders, we can wait for a confirmed move above 121.87 to enter with a tighter stop loss.

Exxon Challenges Short-Term ResistanceExxon Mobil rallied in March and early April. Now, after a pullback, some traders may expect further upside.
The first pattern on today’s chart is the falling trendline along last month’s highs. The energy giant closed above it on Friday, which could be considered a potential breakout.
Second, the low on May 3 occurred near a 50 percent retracement of the preceding advance. Does that confirm the movement of travel is to the upside?
Third, the 50-day simple moving average (SMA) had a “golden cross” above the 200-day SMA in early April. That may suggest its longer-term trend is getting bullish.
Fourth, the 8-day exponential moving average (EMA) is back above the 21-day EMA. MACD could also be attempting a positive cross. Those signals may suggest the short-term trend is getting more bullish.
The fundamental backdrop could additionally be more favorable as China looks to support its real-estate market. Crude-oil inventories were also tighter than expected last week.
TradeStation has, for decades, advanced the trading industry, providing access to stocks, options and futures. See our Overview for more.
Past performance, whether actual or indicated by historical tests of strategies, is no guarantee of future performance or success. There is a possibility that you may sustain a loss equal to or greater than your entire investment regardless of which asset class you trade (equities, options or futures); therefore, you should not invest or risk money that you cannot afford to lose. Online trading is not suitable for all investors. View the document titled Characteristics and Risks of Standardized Options at www.TradeStation.com . Before trading any asset class, customers must read the relevant risk disclosure statements on www.TradeStation.com . System access and trade placement and execution may be delayed or fail due to market volatility and volume, quote delays, system and software errors, Internet traffic, outages and other factors.
Securities and futures trading is offered to self-directed customers by TradeStation Securities, Inc., a broker-dealer registered with the Securities and Exchange Commission and a futures commission merchant licensed with the Commodity Futures Trading Commission). TradeStation Securities is a member of the Financial Industry Regulatory Authority, the National Futures Association, and a number of exchanges.
TradeStation Securities, Inc. and TradeStation Technologies, Inc. are each wholly owned subsidiaries of TradeStation Group, Inc., both operating, and providing products and services, under the TradeStation brand and trademark. When applying for, or purchasing, accounts, subscriptions, products and services, it is important that you know which company you will be dealing with. Visit www.TradeStation.com for further important information explaining what this means.

XOM “Exxon Mobile” Cup & Handle Cup & Handle forming on XOM as the Energy Sector remains bullish in this unpredictable economic environment…..let’s see how this one plays out.

XOM inverted head and shoulders Hi traders!
On the chart we can see inverted head and shoulders pattern. Currently the price is retesting the neckline. We expecting the price will break the resistance. The long position can bee taken once we get a successful break of the neckline.
The technical target for this formation is at 113$ .
Stop loss should be placed below the right shoulder.

Guyana Takes Exxon to CourtGuyana's tax agency is taking Exxon Mobil Corp. ( NYSE:XOM ) to court after one of the company's suppliers claimed it mistakenly inflated the value of oil-well equipment by 200 times to about $12 billion. The Guyana Revenue Authority issued a summons to the oil giant, with a hearing scheduled for May 10. Exxon and Trinidad-based Trinidad-based company Ramps Logistics claimed the overvaluation stemmed from a clerical error that denoted the sum in US dollars instead of Guyanese dollars.
A Guyana dollar is worth about one-half of a US cent. Exxon ( NYSE:XOM ) country manager Alistair Routledge said the error was "caught early" and no one suffered any loss. The company has updated its procedures to prevent repeating the error. Under Guyana's production sharing contract with Exxon, the government only receives its share of production after costs are deducted. Exxon ( NYSE:XOM ) recently approved its sixth development which will help double its production capacity to 1.3 million barrels a day by 2027. The company has agreed to comply with the audit.


Exxon ($XOM) Stock Falls on Q1 Earnings ReportsExxon Mobil ( NYSE:XOM ) and Chevron ( NYSE:CVX ) stocks fall on first-quarter earnings Reports. The first quarter of 2024 has brought forth a flurry of developments, shedding light on the complex dynamics shaping the future of these energy behemoths.
Earnings Woes Amidst Market Headwinds
Both Exxon ( NYSE:XOM ) and Chevron reported disappointing first-quarter earnings, attributing the downturn to lower refining margins and natural gas prices. Exxon's earnings per share fell by 27%, while Chevron experienced a 17% decline, reflecting broader challenges faced by the energy sector amidst fluctuating market conditions. Despite efforts to bolster profitability, including increased production and strategic acquisitions, the supermajors have encountered headwinds that have dampened investor sentiment.
Guyana: The Prize and the Pitfall
At the heart of the supermajors' strategic maneuvers lies the oil-rich territory of Guyana, heralded as a potential game-changer in the global energy landscape. Exxon's prolific operations in Guyana have yielded substantial production gains, providing a glimmer of hope amidst broader market challenges. However, Chevron's attempt to enter the fray through its acquisition of Hess has sparked a bitter dispute, with Exxon asserting its right of first refusal and threatening to derail Chevron's ambitions. As arbitration proceedings loom, the fate of Guyana's coveted resources hangs in the balance, underscoring the high stakes and fierce competition characterizing the energy industry's quest for dominance.
Navigating Uncertain Terrain
Against a backdrop of geopolitical tensions and fluctuating oil prices, Exxon ( NYSE:XOM ) and Chevron face a myriad of challenges as they chart their course forward. While geopolitical risks in the Middle East and evolving demand dynamics pose ongoing challenges, the supermajors remain resilient, buoyed by their strategic assets and global footprint. Despite short-term headwinds, long-term projections indicate continued demand for fossil fuels, offering a glimmer of optimism amidst market uncertainty.
Stock Performance and Future Prospects
Amidst market turbulence, Exxon's ( NYSE:XOM ) stock performance has been reflective of broader industry challenges. Exxon ( NYSE:XOM ) has rebounded modestly from lows remaining committed to capitalizing on growth opportunities and enhancing shareholder value through strategic initiatives and prudent investments. As they navigate the complexities of the energy landscape, Exxon ( NYSE:XOM ) and Chevron stand poised to weather the storm and emerge stronger, reaffirming their status as industry stalwarts.
Conclusion: Navigating the Energy Transition
The first quarter of 2024 has brought forth a confluence of challenges and opportunities for Exxon ( NYSE:XOM ) and Chevron, underscoring the resilience and adaptability required to thrive in today's dynamic energy environment. As they confront earnings declines and strategic disputes, the supermajors remain steadfast in their pursuit of sustainable growth and operational excellence. With Guyana's resources hanging in the balance and global energy dynamics in flux, Exxon ( NYSE:XOM ) and Chevron are at a pivotal juncture in their journey toward securing their position as leaders in the evolving energy landscape.

XOM Exxon Mobil Corporation Options Ahead of EarningsIf you haven`t bought the dip on XOM:
Then analyzing the options chain and the chart patterns of XOM Exxon Mobil Corporation prior to the earnings report this week,
I would consider purchasing the 120usd strike price Calls with
an expiration date of 2025-1-17,
for a premium of approximately $10.05.
If these options prove to be profitable prior to the earnings release, I would sell at least half of them.


XOM Put OptionLooking for downside risk on XOM for the week.
Have outlined what i will be watching for early on in the week and expecting entry early in week.

This is the price zone you want to watch XOM price is stretched.
The stock price recently broke all-time highs
RSI signals that it is overbought.
With geopolitical tension rising, it is risking to short the energy sector, but if you are looking to short XOM pay attention the weekly structure I marked on the chart.
A close below this structure could signal a weekly false breakout and trigger shorts.

Exxon Mobil Corporate cup and handlePossibile break out of a cup and handle pattern on Exxon Mobil Corporation EXO .
Max target at 153.30 , Mid target at 137.30 Fib Ext Lev .
Rsi seem overbought so it remains difficult for me to identify a stop loss that I will place below the first fibonacci level .
Any suggestion is welcome !

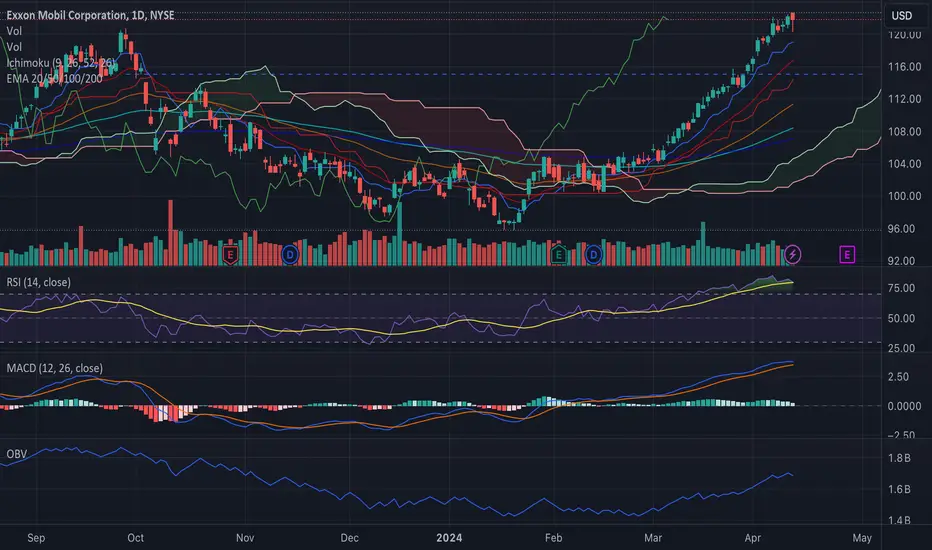
Exxon Mobil Corporation Technical Analysis and OutlookAs of the latest close, Exxon Mobil Corporation (NYSE: XOM) exhibited a commendable performance, with its stock price anchoring at $119.72 and showing a slight uptick in after-hours trading to $120.29. A review of the recent price trajectory reveals a consistent bullish pattern, sustained by a robust upward momentum that bodes well for the prospective investor.
Key Technical Indicators:
Ichimoku Clouds: The price is trading above the Ichimoku cloud, indicating a bullish trend. The cloud's span is widening, which typically suggests strengthening momentum.
Moving Averages: The stock is currently well above its key exponential moving averages (EMAs) — 20, 50, 100, and 200-day lines. The 20-day EMA acting as dynamic support suggests the near-term trend remains decidedly positive.
Relative Strength Index (RSI): The RSI is hovering just below the overbought threshold of 80, marking high enthusiasm among buyers. Yet, investors should be cautious about potential retracement from these levels.
Moving Average Convergence Divergence (MACD): The MACD line is above the signal line and trending upward, reinforcing the bullish sentiment. Notably, the histogram reflects growing buying pressure.
On-Balance Volume (OBV): A steady incline in the OBV underpins the upward price movement, indicating volume is confirming the trend.
Technical Patterns:
Bullish Engulfing Candlestick: The latest candle forms a bullish engulfing pattern, suggesting buyers are overtaking sellers and a continuation of the uptrend may ensue.
Support and Resistance: Immediate support is identified at the $115 mark, while resistance looms near the $122 zone. A breach above resistance could clear the path towards higher valuations.
Market Sentiment and News Integration:
The positive adjustment in earnings forecasts by Zacks Research, now pegging Q2 earnings at $2.40 per share, indicates a stronger financial underpinning that could propel further price appreciation. The upgrade, although modest, may bolster investor confidence and act as a catalyst for continued upward movement.
Moreover, the company's unyielding dividend policy is a testament to its financial health and commitment to shareholder returns, potentially attracting dividend-seeking investors and adding to the buying pressure.
Outlook and Speculative Price Target:
Integrating the fundamental news with our technical standpoint, the landscape for Exxon Mobil is optimistic, with analysts exhibiting a "Moderate Buy" consensus. With the most bullish analyst projecting a price target of $150.00, it suggests a considerable upside potential. Bearing in mind the technical strength and analyst sentiment, we could posit a speculative price target of $135 in the medium term, contingent on market stability and the continuation of the current trend.
Investor Considerations:
While the technical indicators and analyst optimism warrant a bullish outlook, investors must stay vigilant for signs of trend exhaustion or reversal. The pursuit of lower-emission energy solutions showcases Exxon Mobil's adaptability, but regulatory shifts and the pivot to renewable energy sources present variables that could affect future performance.
In conclusion, Exxon Mobil Corporation appears poised to continue its ascent, bolstered by strong technicals, favorable analyst revisions, and a sound dividend policy. As always, investors should maintain a balanced perspective, aligning their strategies with market dynamics and broader economic indicators.
Distance from AvgsHere we have combined a short/long term view of momentum via the Distance from Avg indicator. Explanation and settings noted on chart.
One add'l thought not noted on chart - the "Dots" may show divergence versus price closes, and one can take this into consideration if desired.

XOM bearI am short on XOM recently it touched an all-time high and made a weak high there. In my opinion, XOM needs to consolidated

EXXON MOBIL | Tripple Top Breakout!!EXXON MOBIL has submitted a breakout above its recent resistance of $120.
For the first time on weekly scale, XOM is trading above 120 level as previous week closed above the said resistance.
Manage your risk accordingly. Upside looks promising for target of $143

XOM Breaks out with rising USOILXOM looks to be breaking out from a supply level that has been holding since Nov 2023.
RSI over 60, rising 55D SMA.
Stop Loss: 102.65
Target 119.92, 120.69
Note: This analysis is for educational purposes only and is not a buy/sell recommendation.

Exxon. looking backhigh probability entries. using macd, BB (20wma) and trend line secrets. cycles in the back.
leaving this for fun, for future reference.

Exxon Mobil Signals Profit Dip Amidst Weak Oil and Gas PricesExxon Mobil ( NYSE:XOM ) faces turbulent seas ahead as it braces for a dip in first-quarter operating results, signaling a departure from the record-breaking profits of yesteryears. With weaker oil and gas prices, coupled with significant losses in fuel derivatives, Exxon ( NYSE:XOM ) finds itself navigating through challenging terrain after two years of unprecedented prosperity.
Navigating Market Volatility:
The once-profitable energy giant now grapples with the impact of fluctuating natural gas prices and fuel derivatives, marking a stark reversal from the buoyant market conditions of previous quarters. Despite its efforts to weather the storm, Exxon's operating profit for the quarter is projected to plummet, underscoring the harsh realities of a volatile market environment.
Profit Projections and Investor Sentiment:
Investors brace for a downturn in Exxon's fortunes, with adjusted per-share profit expected to fall short of previous benchmarks. Financial firm LSEG's consensus estimate paints a sobering picture, reflecting a decline in profitability compared to the company's robust performance in the year-ago period. As Exxon's profitability wanes, investor confidence faces a stern test amidst mounting uncertainties.
Factors Contributing to Profit Erosion:
The erosion of Exxon's profits can be attributed to a confluence of factors, including plummeting natural gas prices and adverse movements in fuel derivatives. The company's bottom line takes a hit as refining maintenance costs surge, exacerbating the financial strain caused by weakened market conditions. Against this backdrop, Exxon grapples with the formidable task of mitigating losses and safeguarding shareholder value.
Strategic Moves Amidst Adversity:
In the face of adversity, Exxon ( NYSE:XOM ) remains proactive in its pursuit of strategic opportunities to bolster its position in the market. From all-stock deals with U.S. shale oil producers to assertive claims over prized assets, Exxon ( NYSE:XOM ) demonstrates resilience in the face of market headwinds. However, the path forward remains fraught with challenges as the company navigates a rapidly evolving energy landscape.
Technical Outlook
Exxon Mobil ( NYSE:XOM ) stock is trading above the 200, 100, and 50-day Moving Averages respectively with a Relative Strength Index (RSI) of 85.21 indicating an overbought position for the stock. NYSE:XOM 's 1-day chart shows a cup and handle pattern indicting the potential for a downturn at any moment.

Lookin bullish immediately on XOM!🔉Sound on!🔉
Thank you as always for watching my videos. I hope that you learned something very educational! Please feel free to like, share, and comment on this post. Remember only risk what you are willing to lose. Trading is very risky but it can change your life!

Exxon Mobil - Increased probability of appreciationInterpretation:
Previously disorganized Fibo clouds have gradually lined up giving favorable support to the evolution of the candles. The compacting of fibo clouds from different timeframes signals direction and strength towards the first target to be reached
Reaching the first target makes it necessary to move the stop loss to the position where the entry was made. The purpose of this action is to protect the result that has been achieved and to ensure that there is plenty of time to search for the remaining targets with a reduced risk of losing the trade.
The use of risk management, an integral part of this method, has been fundamental in achieving planned results.
Risk Return Ratio 3
