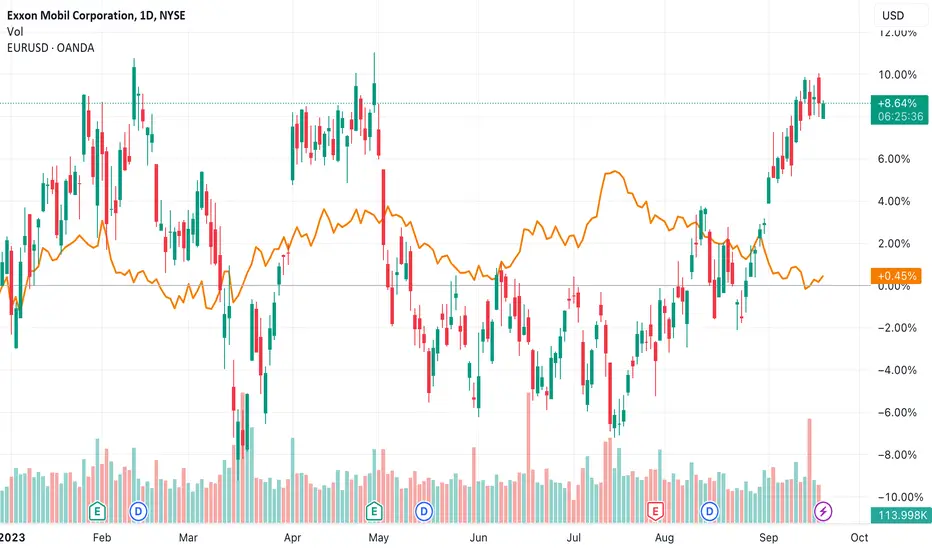
XOM, HUGE WAVE-EXTENSIONS, Oil-Market View, UPCOMING TRENDS!Hello There!
Welcome to my new analysis about XOM on several timeframe perspectives. The oil market has shown up with a massive pullback to the downside since the war developments have put heavy pressure on the whole oil market and drove the supply rally within the market. Since then the market managed to recover with a substantial rally moving into new all-time-highs and is actually forming a massive gigantic formational-structure here from where the market is setting up further determination dimensions.
Currently XOM is forming a continuation-formation on the local timeframes which is an crucial wedge-formation, and this wedge-formation has a increased potential to complete within the next times. Once this formation has been completed the targets as mentioned in my analysis are going to be activated. From there on the volatility within the market has to be determined further and if the already established XOM developments hold on there is an increased possibility for the market to continue into the already established direction.
XOM being the largest market-cap stock within the oil market sector is driving the oil market and wall street developments of oil stocks increasing by over 60%. The fact that the oil market could recover from the main war shocks that showed up with massive bearish pullbacks within the whole market does not mean this holds true for the whole stock market because there are sector stocks within the market that actually show greater bearish inclinations. In this case it will be highly determining on how the whole oil market actually continues and if the established dynamic holds on for this sector stock.
In this manner, thank you everybody for watching the analysis, support from your side is greatly appreciated.
VP
XOM trade ideas

XOM: $120 Price TargetEntered this one on last Thursday with some $117 October calls. 1h Chart on the left got us our golden pocket entry and now we're trying to regain the uptrend. Looks like we'll get one more chance to enter under $115.35 where there is a set of very clear equal lows from where I see us bouncing to $120 sometime into next week.

XOM shortXOM short position with 1st TP at level $102 and 2nd level $92.
Warning!!!!
This content should not be interpreted as financial advice.

XOM time for a pull back NYSE:XOM Evaluating Entry Opportunities Amid Rising Oil Prices
In the realm of market analysis, it has come to attention that the price of oil has been on an upward trajectory for a sustained period. Such an environment often piques the interest of investors and traders seeking opportune moments to initiate positions. Let's delve into the factors and considerations pertinent to assessing whether this is indeed a favorable juncture for entry into the oil market.
Price Trend Analysis: The foremost aspect to scrutinize is the price trend of oil. A consistent upward movement in oil prices may be driven by various factors, such as increased demand, geopolitical tensions, or supply constraints. To ascertain the strength and sustainability of this trend, it's crucial to examine historical price data and technical indicators. This analysis aids in understanding the underlying market dynamics.
Fundamental Factors: Fundamental analysis plays a pivotal role. Evaluate the fundamental drivers behind the rising oil prices. Are there geopolitical tensions in major oil-producing regions? Has there been a significant shift in global demand? Keeping a close eye on factors like these can help you gauge the longevity of the price surge.
Supply and Demand Dynamics: The oil market is heavily influenced by the balance between supply and demand. An imbalance, whether due to production cuts or sudden increases in demand, can lead to price fluctuations. Thoroughly assess the current supply and demand dynamics to anticipate future price movements.
Technical Indicators: Utilize technical indicators, such as moving averages, Relative Strength Index (RSI), and trendlines, to identify potential entry points. These tools can help in pinpointing favorable buying opportunities within the context of the prevailing uptrend.
Risk Management: Assess your risk tolerance and develop a robust risk management strategy. This includes setting stop-loss levels, determining position sizes, and considering potential adverse scenarios. Oil prices can be highly volatile, and prudent risk management is essential to protect your capital.
Diversification: Consider how an investment in oil fits into your broader portfolio. Diversification across asset classes can help mitigate risk. Ensure that your decision to enter the oil market aligns with your overall investment objectives and risk profile.
Market Sentiment: Keep a finger on the pulse of market sentiment. Sentiment can sway oil prices significantly, especially in the short term. News, social media, and expert opinions can provide valuable insights into market sentiment.
Global Events: Be mindful of global events that can impact oil prices. These include OPEC decisions, geopolitical conflicts, economic data releases, and environmental regulations. Any of these factors can swiftly alter the trajectory of oil prices.
Long-Term vs. Short-Term Strategy: Determine whether you are pursuing a short-term trading opportunity or a long-term investment in oil. Your strategy should align with your investment horizon and objectives.
In summary, while a sustained uptrend in oil prices may appear attractive for entry, it's crucial to conduct comprehensive analysis, factor in your risk tolerance, and stay informed about the multifaceted forces influencing oil markets. Consider consulting with financial advisors or experts who specialize in commodities for personalized guidance before making investment decisions. Remember that investing in commodities, like oil, carries inherent risks, and a well-informed approach is vital to success.

Value vs Growth - XOM vs AMZNI suggested it was time to rotate away from frothy growth stocks that were pumped by the AI narrative recently, and buy into value stocks. I've discussed the bull case for India, Crude Oil, etc. at length already, and the signal from Ten Year Yields pointing for much higher rates, which together with deglobalization and various other bearish and inflationary fundamental cues swayed me in this direction.
We now have a nice signal in Exxon, which by itself is trending up in monthly scale and has ample upside (I got some long term OTM call options going). I added long exposure as a pair trade vs Amazon today.
You have roughly 20% downside risk to make close to 100% in the ratio now.
Which is a very attractive return.
Additionally, track the VTV vs VUG ratio, although the mega cap value ETF is a bit riskier than energy itself, it will likely follow this trend as well. (Or more simply put, SPY vs QQQ)
Many ways to express the same idea, which revolves around the trend in rates.
Best of luck!
Ivan Labrie.

Exxon Mobil is setting for the breakoutExxon Mobil in focus this week amid strength of Crude oil and increasing bullish sentiment for energy assets. Technically, it might break the 119.50 level: should this happen, bullish momentum can accelerate. The main event in focus: FED's decision and a press-conference of Jerome Powell.
XOM Inside Bar w/ Bullish TrendTitle says it all, possible Higher Low being punched in on the 4h with an Inside bar candle stick con firming that sellers are exhausted and buyers may be stepping in to take back over. CALLS valid above green line, Pt white dashed lines.

Short term bearish diamond to $113 ppsShort term bearish diamond for scalp or day traders...May take us to $113 first followed by a bounce and continuation down towards $100 psych in the coming week(s).
Educational purposes only!

XOM Likely to Face Resistance at $119.71 All-Time High
I have been tracking XOM since joining the group in May. I was hopeful that XOM would present a buy opportunity at the $94 green trendline, but XOM showed a lot of bullishness at $100.
In July I decided to adjust my buy target to a $101-104 buy zone, marked by the white circle and entered into a trade there.
XOM has experienced a bullish 8-week rally and is nearing its $119.71 all-time high price target.
XOM has already broken above the upper range of the Bollinger Band, which is sitting at $116.29. I believe that XOM is overbought and will drop back into the Bollinger Band range.
XOM is approaching a key price target, which is the red resistance line at XOM’s $119.71 all-time high.
I’m looking for XOM to climb shortly above this red resistance line before having a pullback (drawn with a white line and arrow).

XOM has shown a consolidation patternXOM has shown a consolidation pattern
This chart shows the weekly candle chart of ExxonMobil's stock in the past 4 years. The graph overlays the bottom to top golden section at the beginning of 2020. As shown in the figure, ExxonMobil's stock has shown a consolidation pattern of high to strong overall after completing a small level double top at the beginning of this year! The small double top of ExxonMobil's stock at the beginning of this year was suppressed by the 3.618 level of the gold split at the bottom of the graph, and did not touch any strong support level for the low point of the pullback thereafter! So, in the future, the stock market of ExxonMobil is likely to weaken and continue to retreat towards the downside!

XOM Triple BottomSimple triple bottom pattern on XOM with macro momentum shifting back bullish after a period of consolidation before the next leg up. Profit target is the highs and runners after if you wish. 20% Stop loss 9/8 expo, after green level is broken. If stop is hit look for re-entry above green level according to 10m chart price action. Expect this play to go 50%+ but nothing in the market is ever 100%.

$XOM Parallel Uptrend The trajectory of NYSE:XOM reveals a parallel uptrend, mirroring the recent impressive performance of energy stocks. Currently, the energy sector exudes a distinctly bullish sentiment, underpinned by notable market trends. A bullish outlook prevails as long as NYSE:XOM maintains a position above the crucial threshold of 104, indicating a potentially promising trajectory for this energy giant.

$XOM with a bullish outlook following its earnings #StocksThe PEAD projected a bullish outlook for NYSE:XOM after a negative over reaction following its earnings release placing the stock in drift C with an expected accuracy of 66.67%.

Exxon May Be Trying to Break OutEnergy is the only sector with a positive return so far in August. Today’s chart focuses on Exxon Mobil, the biggest and most liquid name in the group.
First consider the trendline along the highs of May 8 and July 3. XOM surged after breaking out and has now come down to hold the same line. Is old resistance becoming new support?
Second, last week’s lows represented a 50 percent retracement of the move from the July low to the August high.
Third, the 8-day exponential moving average (EMA) has remained above the 21-day EMA. That potentially suggests its short-term trend is getting bullish. (Only 21 percent of S&P 500’s members could make make such a claim last Friday, according to TradeStation data.)
Last week’s bounce also occurred at the 50-day simple moving average (SMA), which is additionally trying to turn higher.
These points could make traders look for more gains if XOM can break the falling trendline that’s appeared since mid-August.
Finally, fundamentals may support energy. Crude-oil inventories have been lower than expected the last two weeks and the Strategic Petroleum Reserve (SPR) recently hit the lowest level since late-1983.
TradeStation has, for decades, advanced the trading industry, providing access to stocks, options, futures and cryptocurrencies. See our Overview for more.
Important Information
TradeStation Securities, Inc., TradeStation Crypto, Inc., and TradeStation Technologies, Inc. are each wholly owned subsidiaries of TradeStation Group, Inc., all operating, and providing products and services, under the TradeStation brand and trademark. TradeStation Crypto, Inc. offers to self-directed investors and traders cryptocurrency brokerage services. It is neither licensed with the SEC or the CFTC nor is it a Member of NFA. When applying for, or purchasing, accounts, subscriptions, products, and services, it is important that you know which company you will be dealing with. Please click here for further important information explaining what this means.
This content is for informational and educational purposes only. This is not a recommendation regarding any investment or investment strategy. Any opinions expressed herein are those of the author and do not represent the views or opinions of TradeStation or any of its affiliates.
Investing involves risks. Past performance, whether actual or indicated by historical tests of strategies, is no guarantee of future performance or success. There is a possibility that you may sustain a loss equal to or greater than your entire investment regardless of which asset class you trade (equities, options, futures, or digital assets); therefore, you should not invest or risk money that you cannot afford to lose. Before trading any asset class, first read the relevant risk disclosure statements on the Important Documents page, found here: www.tradestation.com .

Finding support near 200MA looking bullish. XOM is looking bullish in this area near the 200MA and other moving averages consolidating. Being cyclical this trade could make modest gains going into the colder months. October 120 calls.

RectangleThis is at the top of the chart and the high of 119.92 is the ATH.
Neutral until broken.
There are rising wedges over 2 years old under price. The bottom line has not been broken on these wedges so they are not valid.
NO recommendation.

XOM to ATHObserving the one-day chart of Exxon Mobil, I’ve spotted an upward trend highlighted in yellow. Recent price action shows strength, with a bounce just before the support level. And, we’re seeing a breakout from a smaller downward channel, followed by a return to test it.
The stock closed a gap at 107.73, reinforcing its upward potential. With strong momentum and this backtest, I believe XOM could aim for new highs. My first profit target is 114.45, coinciding with gap fill.

XOM 4H (Update)As expected, Exxon's shares broke through the designated zone and experienced substantial growth. Currently, they are retracing back to the breached area. If this region ( 108$ ) holds, the possibility of further growth for these shares from this point will remain available

XOM, DailyIn our list, today, is Exxon's Mobil stock, as energy markets are on the move: Crude oil and natural gas are gaining momentum. That’s why the “Oil and Gas exploration” sector might be interesting right now, especially considering a rotation from tech stocks towards other sectors.
A trade location around 200-day moving average and a breakout of the chart formation, makes XOM a candidate for a rally.

Double top form of ExxonMobil's stock has been completedDouble top form of ExxonMobil's stock has been completed
This chart shows the weekly candle chart of ExxonMobil's stocks over the past 4 years. The graph overlays the bottom to top golden section at the beginning of 2020. As shown in the figure, the small-scale double top form of ExxonMobil's stock has been completed. Now, there is a long short competition at the bottom of the figure against the 3.000 and 3.272 positions in the golden section, and it is likely to break down in the future! For a period of time to come, just use the long start level of ExxonMobil's stock in late March this year at $99.63 as the long short divide!

Weekly chart of $XOM is bullishNYSE:XOM
Weekly chart of NYSE:XOM is bullish. Can see new highs by end of year

XOM Exxon - Spring Coiled Or Hanging By A Thread?Every time the price of oil goes up, there's a group of bulls that are sure they're catching the train to $150. I mean, I do think oil will go to $150, and there has to be a bottom that comes first, so there's that.
But with fossil fuels and energy producers it seems the pumps are rare, the consolidations are frequent, and the dumps are more common.
In two recent calls, I suggest that oil may actually be on its way to a 3-handle
Oil - A New Long Leg Down Soon Begins
This particular thesis is at something of its inflection point. All the way to $85 would not be surprising, nor would it invalidate the short trade. But here we chop in the $80s.
For Natgas, in a recent call, I suggest that price needs to raid $1.6~ before the rocket mission to $10 can commence
NatGas - No Moon Until Doom
Natty has rallied fairly meaningfully in the last few days, and it may even actually finally punch out $3. But if it can't continue from there, the idea may still be correct.
A big tell that something isn't right in the bull thesis for Exxon is that after the highs were swept in April at $119~, everyone long over $111 has remained trapped ever since, with price not following oil's recent $20 rally.
Now for Exxon, something that's really notable is that the CEO recently bought himself some 650,000 shares for $69 million. This makes many people believe that new highs simply have to be coming.
When we look at monthly candles, we can see we're "flagging" above the old All Time High, there's no indication that it's a reversal, and yet, for three months, there is no reversal.
On the weekly, last week's price action gave the appearance that it's finally time, but it may have just been a stop sweep over the range high.
It's notable oil is pumping, but Exxon is not, despite its stellar earnings report.
An important thing to note about Exxon is next dividends ex-date is August 15 and the payout is 91 cents a share. The CEO will pick up some $591,000+ in cold cash mitigating his position.
It's also worth noting that when it comes to insider buys, they aren't necessarily indicative that price is going to go up before it goes down.
The man may have understood he could make more than the 5% he can earn in the money market by buying Exxon and loaning the shares out to short sellers, combined with dividend payments, over the next year, for example.
The most rational place for Exxon to correct to, if it were to correct, is the $68 level.
There are a lot of geopolitical risks right now with China, the Chinese Communist Party, Xi Jinping, and the CCP and the Jiang Zemin faction's 24-year persecution and organ harvesting genocide against Falun Gong.
This is really the biggest piece of the puzzle that you need to educate yourself with, but establishment media doesn't talk about it.
All of this directly impacts the oil market. And the War in Ukraine impacts the oil market, because if the War is called off then Russian oil is going to flow worldwide again and amount to a big time supply increase.
Things can change any time.

XOM Daily (Bullish Scenario)EXXON on the daily timeframe has been below a significant resistance level ( 108 ) for 81 days, and it's not showing signs of breaking out and growing yet. If it manages to break above this area and exhibits strong momentum, we can expect a good potential for growth.
