Z trade ideas

Z Bull Flag Breakout$Z is breaking out to new highs again before $RDFN earnings in an hour. Housing market has been on fire and $RDFN $Z should benefit. I hate earnings plays so I have a half position currently as I want the ability to double up after earning's prints. Also possible $Z gap up on $RDFN blowout so I want to take the risk exposure. I am long Jan $100c and short Sept $65p


Z primed for a breakoutAfter that uneasy tussle after that breakout on resistance, it now has a flag with a bullish close on top of the flag, primed for a valid breakout.


C&HExpected earnings are 8-6 Stop under 54.25
Possible break out (B/O) is 66.8
Remains to be seen. This is one of those that go up or down with little regard to earnings . They do not miss an awful lot
Not a recommendation


ZILLOW SHORT!ALL TIME HIGH, INSIDR SELL AT ARROW, NO UPWARDS BREAKOUT.... IF DROPS PAST REDLINE TOMORROW SHORT TO NEXT SUPPORT... OR LOWER....OR I COULD BE COMPLETELY WRONG!! LOL! NOT ADVICE JUST AN OPPINION... GOODLUCK GUYS AND GALS!


Cup and Handle Ascending TriangleBroke prior yearly high today
Earnings 8-5 amc
Short percent is on the high side I see a lot of support at 16/62ish
Not a recommendation

ZILLOW GROUP: PROBABLE BREAKOUT Hello Traders!
Yesterday the price of Zillow Group has broken out of the historical resistance level, trading at the highest historically. The RSI also is looking bullish and the MACD has seen a bullish cross and reversal.
It seems a great opportunity to go long as the price is expected to gain a strong bullish momentum!
TARGET PRICE: 79.05
STOP LOSS: 55.45
Please maintain proper position sizing and risk management!

Z Long SetupIH&S on the daily with a neckline break that could send Z to ATHs. Historically, Z has been held down from a level of incredibly strong resistance. DMA's have caught up and new accumulation creating a new base of support as well as reversal in the indicators could push Z up. Next strong level of confluency is at 80, which I hold as my next PT for Z on a break of its resistance.

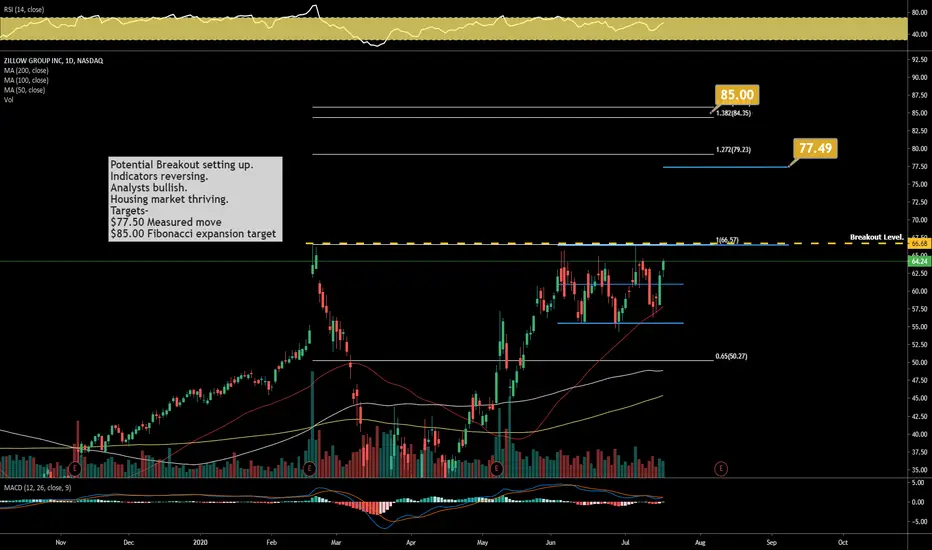
$Z Zillow Breakout imminent
Potential Breakout setting up.
Indicators reversing.
Analysts bullish.
Housing market thriving.
Targets-
$77.50 Measured move
$85.00 Fibonacci expansion target
PLEASE GIVE US A LIKE IF YOU FIND OUR CONTENT HELPFUL, THANK YOU.
Zillow Group $Z$Z is very close to the pivot has been trying to break since 2018. watch for a breakout $66.44 with high volume.
12 months Consensus Price Target: $62
if you find my charts useful, please leave me "like" or "comment".
Please don't trade according to the ideas, rely on your own knowledge.
Thx


Zillow Group Inc.Are you team blue or team pink?
Will a fourth advance be enough to place Zillow above $67 per share?

ZILLOW GROUP chart analysis figureZILLOW GROUP chart analysis figure in a neutral investment period!!!

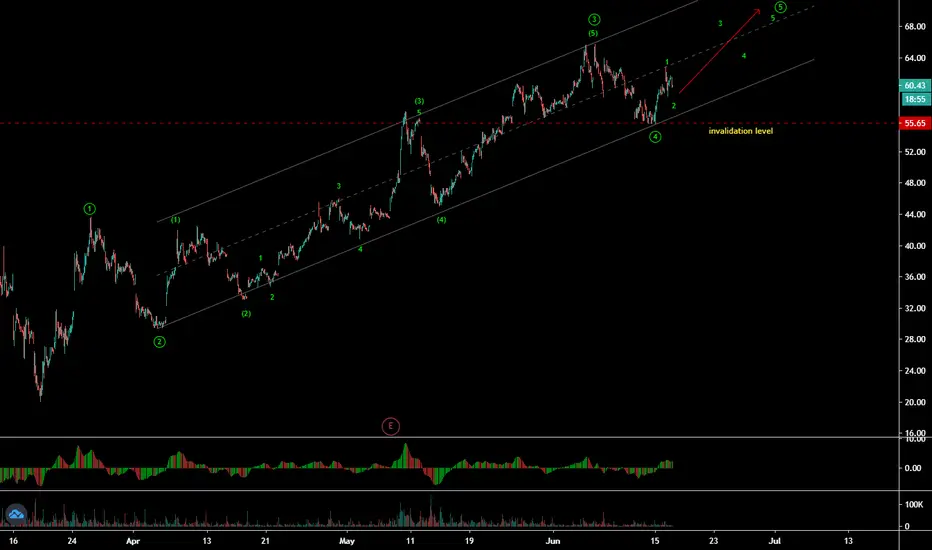
Zillow Group Inc (Z - NASDAQ) - Impulse wave patternZillow Group Inc (Z - NASDAQ) has completed 4th wave ABC correction and moving up in 5th wave final move up.it is moving in wave 2nd which might take one more low to complete in 5 min time frame as c wave. , which will be ideal entry for move up, until it holds the invalidation level of 4th wave low.
Z ZILLOW - DAILY Bullish Engulfing SetupZ ZILLOW
DAILY BULLISH Engulfing Setup
Perfect Entry 55 - 57
ENTRY = 55-60
1st Target = 66+ New Highs
Engulfing Candle on Daily
786 &20ema support @ 56
Bottom of current regression uptrend.
Holding 20ema & .5fib@ 56 support
Stoch, macd, ttm squeeze & momentum BULLISH
________________________________________________
This content is for informational and educational purposes only. This is not in any way, shape or form financial or trading advice.
Good luck, happy trading and stay chill,
2degreez

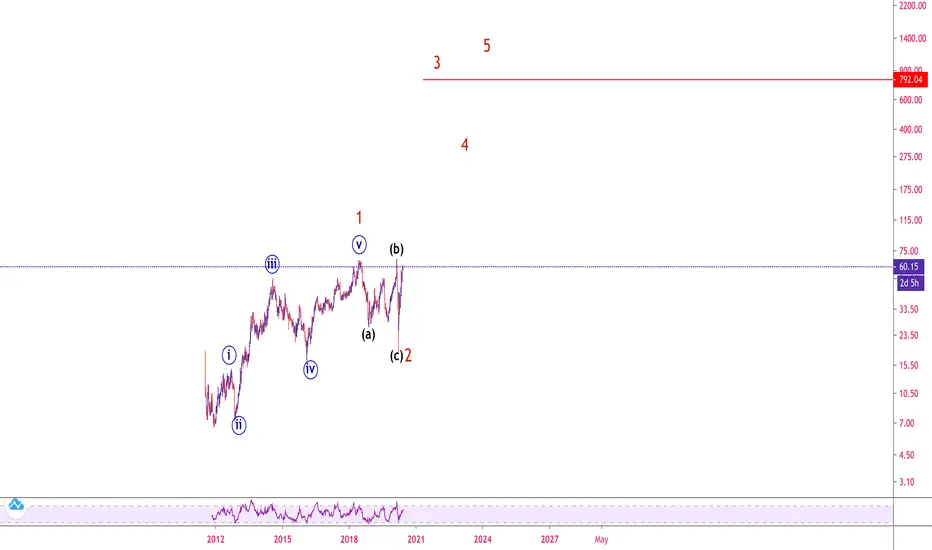
Zillow in big Impulse Cycle.Zillow completed 5 wave of cycle 1 and wave 2 of cycle 1 is also completed.
Expecting to rip higher in coming months..

ZG Round upZG has recently bounced up off its supporting trendline and has formed a bullish rounding formation. Target is $53 before the gap in the hourly chart, which will act as resistance. The 13 and 30 ema are forming a crossover, which signifies another bullish movement on hourly chart.
