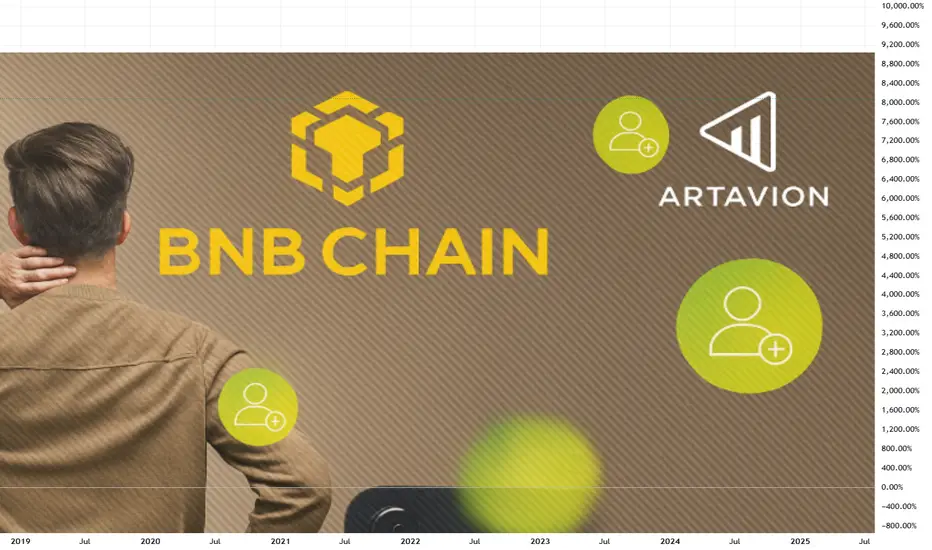
Artavion: A New Era for BNB Chain Scaling to Nasdaq-Level SpeedBNB Chain Prepares for an Infrastructure Breakthrough
As the crypto market matures, competition among blockchains goes far beyond basic functionality. In July 2025, BNB Chain — Binance’s flagship network — announced a strategic initiative to scale its infrastructure to levels comparable to Nasdaq’s
Key data points
Previous close
—
Open
—
Day's range
—
About Market Cap BNB, $
Coin
Since its launch in 2017, Binance has been showing a drive for development and willingness to become a provider for the entire blockchain ecosystem. And it's been true to its mission, launching more and more services in various spheres, including its own utility token — BNB — that lets both the exchange and traders win: BNB lets traders benefit from reduced trading fees, and the exchange gets the increased investor interest. Looks like the coin has impressive prospects, though it's important to keep an eye on it. To help you with that we've calculated BNB market capitalization and displayed it on the chart — it can tell you how investors' feel about the coin and whether it still presents a reliable investment tool, just analyze the line's direction and try to spot upcoming trends.
BNB Price Analysis: Key Levels to Watch in the Next 12 HoursBinance Coin (BNB) has shown significant activity in recent trading sessions, and the next 12 hours are expected to bring further price movements. Based on current market trends and technical indicators, here’s what traders and investors can anticipate:
Price Movement Expectations:
BNB is expected

Binance Coin - BNB Cryptocap / Idea I hey guys,
Yearly candle: inside bar - indication of possible upmove.
-> targets : 84 and 117 (previous ATHs)
-> levels are crucial for a resumed uptrend to be in place on the yearly chart.
Quarterly: Shooting Star below "showdown zone" - fib extension box from the yearly inside bars range BUT ab

Rocket launch after the summer at BNBI still expect the summer to be a long-term low, I hope I'm not mistaken and I don't miss the purchase, however, if it turns out that way, I expect to buy BNB at a price of around 152-160 USD/BNB and the subsequent rocket growth until February/March 2024

BNBThe BNN (presumably an asset or currency) is currently exhibiting a supply zone at the level of 88.428. This signifies a significant area where sellers are dominating, potentially leading to a reversal or a decline in price. Supply zones represent critical points on a price chart where selling press

BNB roadmapbnb roadmap view in long time
its in best zone for long move
be safe and
trade with your own strategy
good luck

Binance (Build and Build): Facing the SEC and the FUDSBinance Coin (BNB), the leading cryptocurrency exchange in terms of volume, has seen gains in its weekly chart, giving investors hope for more profits. According to the latest data, things could get even better as BNB’s Galaxy Score is at its highest level among the top cryptocurrencies, which is pr

Binance Coin (BNB) - How to trade Crypto? Vol. 003Welcome to SharedCryptoBot!
Binance Coin (BNB)
Binance Coin is in a strong consolidation zone after a long drawdown, there is only one strong supply level left.
We will update this post!
Leave us some love and let us know what you think down below <3
SharedCryptoBots

BNB Market Cap Looks Ready to Fall From a $20 Billion CliffI have made a few bearish Charts about BNB in the past and this is just a small followup and reminder of what seems like the dump to come.
BNB has broken below all major moving averages and has been rejected from the 200-week SMA and now, if we break below $30B in market cap there will be no suppor

BNB's ROCKETOn the chart we can see a symmetrical triangle pattern, which is a neutral pattern meaning that it can breakout either to the upside or to the downside.
Enter the trade once the price breaks out of the triangle.
Look at the volume surge in order to avoid the false breakout.
Targets for long and f

See all ideas
Summarizing what the indicators are suggesting.
Oscillators
Neutral
SellBuy
Strong sellStrong buy
Strong sellSellNeutralBuyStrong buy
Oscillators
Neutral
SellBuy
Strong sellStrong buy
Strong sellSellNeutralBuyStrong buy
Summary
Neutral
SellBuy
Strong sellStrong buy
Strong sellSellNeutralBuyStrong buy
Summary
Neutral
SellBuy
Strong sellStrong buy
Strong sellSellNeutralBuyStrong buy
Summary
Neutral
SellBuy
Strong sellStrong buy
Strong sellSellNeutralBuyStrong buy
Moving Averages
Neutral
SellBuy
Strong sellStrong buy
Strong sellSellNeutralBuyStrong buy
Moving Averages
Neutral
SellBuy
Strong sellStrong buy
Strong sellSellNeutralBuyStrong buy
Displays a symbol's price movements over previous years to identify recurring trends.