“BNBUSD Educational Breakdown – Support Rejection “BNBUSD Educational Breakdown – Support Rejection with $846 Target in Sight”
Market Structure Overview:
BNBUSD is exhibiting a bullish market structure after forming a textbook higher low at the major demand zone near $740–$750. This zone has been historically significant, offering strong rejections and triggering aggressive bullish rallies.
A new bullish wave appears to be forming after price respected the ascending trendline and reclaimed the supertrend level, now acting as dynamic support around $782.2.
⸻
🔧 Technical Confluences:
• Support Zone: Highlighted between $738–$750, serving as a demand base. Recent price rejection here confirms buyers’ dominance.
• Trendline Support: Price has respected an ascending trendline, signaling short-term trend continuation.
• Supertrend Confirmation: Trend flip has occurred—price is now trading above the Supertrend line, indicating a fresh bullish momentum phase.
• Break of Structure (BoS): Minor resistance around $784–$790 was breached, suggesting bullish continuation.
⸻
🎯 Target Projection:
Using recent swing highs and market symmetry, the next logical resistance lies at $846.9, aligning with the previous supply zone. This target also fits within the measured move from the support base to previous highs.
⸻
📈 Trade Plan (Educational Only):
• Long Bias Zone: Between $770–$780
• Invalidation Level: Below $738 (loss of support structure)
• Target: $846.9
• Risk-Reward: Roughly 1:2.5 – favorable for swing traders
⸻
📚 Educational Note:
This chart is an excellent example of:
• Structure trading (support/resistance)
• Trend confirmation using a dynamic indicator (Supertrend)
• Risk-managed entries with clearly defined stop-loss and take-profit zones.
BNBUSD trade ideas

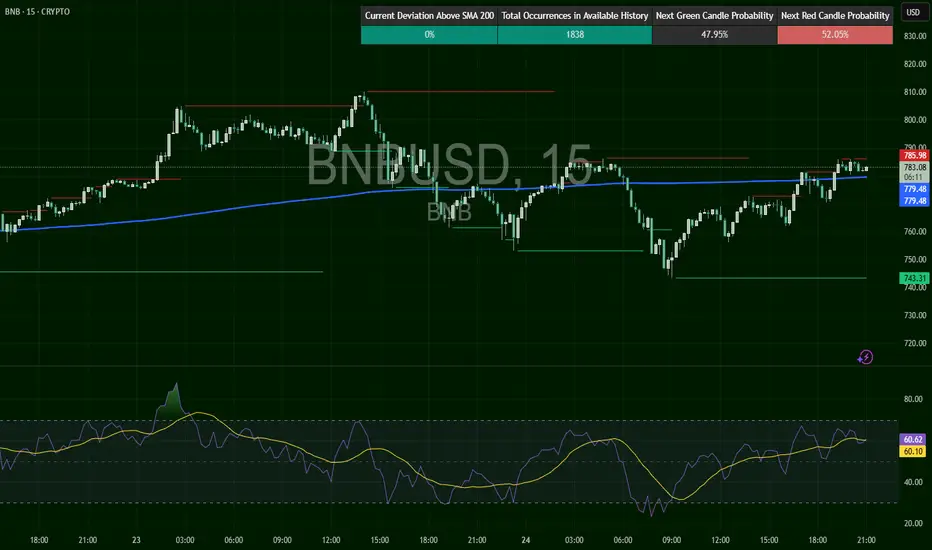
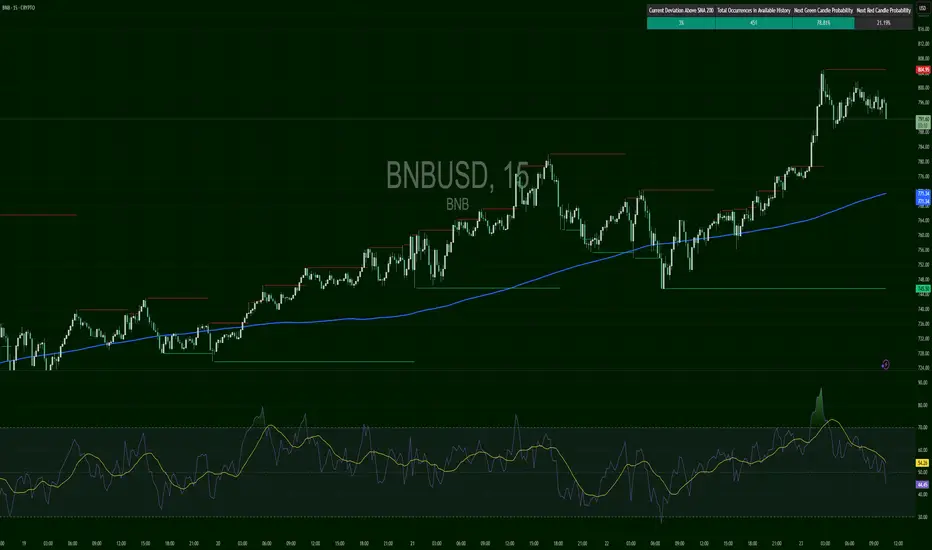
BNBUSD – Ready to Burst or Back OffBNB pulled back and held the 200 SMA, then surged from $743 → $785. Price is now consolidating just below the breakout zone. RSI at 60.04, momentum positive but slowing. Watch for breakout >$786 to trigger continuation. Failure to break = possible fade back to $770.
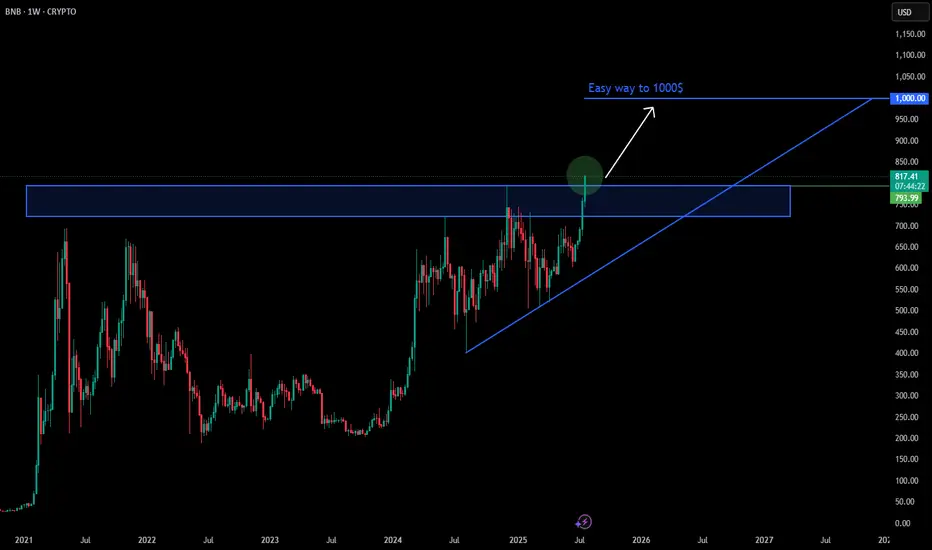
BNB easy to 1000$BNB has clearly broken above a key resistance zone between $793 and $820. The weekly close above this level is a strong bullish signal.
✅ If price holds above this area, the path toward $1000 becomes technically easy and highly likely, supported by a steady long-term uptrend.
📌 Summary: Holding above $820 could lead BNB directly to $1000, with a possible retest acting as confirmation.
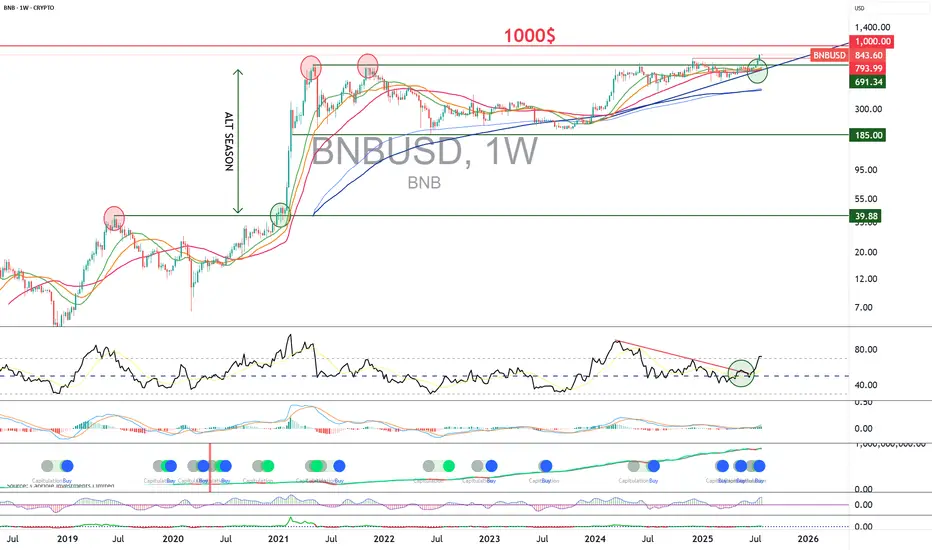
BNB/USD at $1,000 in this cycle?The underlying uptrend in the BNB/USD token is a major barometer of the overall health of the crypto market, and more broadly, of investor interest in altcoins. In the previous cycle, back in January 2021, the bullish breakout of the all-time high (ATH) on BNB/USD was a leading indicator of the altcoin season. In our current cycle, BNB/USD is on the verge of breaking above its ATH once again. If this breakout happens, it would be a positive signal for altcoins.
1) Why tracking BNB/USD’s underlying trend is essential to anticipate the crypto market’s health
In the crypto ecosystem, some assets serve as overall market barometers. BNB, issued by Binance, is one of them. Monitoring BNB/USD is not only relevant for holders of the token but also for any investor looking to assess the general state of the crypto and altcoin markets.
Why? Because Binance is by far the largest global platform in trading volume—both in the spot and derivatives markets. The BNB token thus directly reflects the momentum of the Binance ecosystem and, by extension, a major segment of the crypto industry.
When BNB is in a sustained uptrend, it generally signals renewed activity, increasing volume, and growing investor confidence. Conversely, a prolonged downtrend may suggest progressive disengagement by market participants and broader downside pressure on altcoins.
Moreover, activity growth or contraction on Binance almost automatically leads to shifts in demand for BNB, which is used for trading fees, launchpad services, and DeFi. This makes BNB an early indicator of liquidity and vitality in the space.
Integrating BNB/USD technical analysis into your market monitoring strategy is, in essence, observing the pulse of the crypto markets.
2) From a technical analysis perspective, a bullish breakout above BNB/USD’s ATH would be a strong altseason signal
The chart below shows the weekly candlestick data for BNB/USD. Looking back at winter 2021, the breakout above the ATH coincided with the beginning of the altcoin season.
As such, I’m keeping a close watch on the current ATH of $794. If BNB/USD manages to break through this resistance, it would be a very bullish signal for altcoins and would set a technical target at $1,000.
However, as of now, this breakout has not occurred. A break below the key support at $690 would invalidate the bullish outlook for this cycle.
DISCLAIMER:
This content is intended for individuals who are familiar with financial markets and instruments and is for information purposes only. The presented idea (including market commentary, market data and observations) is not a work product of any research department of Swissquote or its affiliates. This material is intended to highlight market action and does not constitute investment, legal or tax advice. If you are a retail investor or lack experience in trading complex financial products, it is advisable to seek professional advice from licensed advisor before making any financial decisions.
This content is not intended to manipulate the market or encourage any specific financial behavior.
Swissquote makes no representation or warranty as to the quality, completeness, accuracy, comprehensiveness or non-infringement of such content. The views expressed are those of the consultant and are provided for educational purposes only. Any information provided relating to a product or market should not be construed as recommending an investment strategy or transaction. Past performance is not a guarantee of future results.
Swissquote and its employees and representatives shall in no event be held liable for any damages or losses arising directly or indirectly from decisions made on the basis of this content.
The use of any third-party brands or trademarks is for information only and does not imply endorsement by Swissquote, or that the trademark owner has authorised Swissquote to promote its products or services.
Swissquote is the marketing brand for the activities of Swissquote Bank Ltd (Switzerland) regulated by FINMA, Swissquote Capital Markets Limited regulated by CySEC (Cyprus), Swissquote Bank Europe SA (Luxembourg) regulated by the CSSF, Swissquote Ltd (UK) regulated by the FCA, Swissquote Financial Services (Malta) Ltd regulated by the Malta Financial Services Authority, Swissquote MEA Ltd. (UAE) regulated by the Dubai Financial Services Authority, Swissquote Pte Ltd (Singapore) regulated by the Monetary Authority of Singapore, Swissquote Asia Limited (Hong Kong) licensed by the Hong Kong Securities and Futures Commission (SFC) and Swissquote South Africa (Pty) Ltd supervised by the FSCA.
Products and services of Swissquote are only intended for those permitted to receive them under local law.
All investments carry a degree of risk. The risk of loss in trading or holding financial instruments can be substantial. The value of financial instruments, including but not limited to stocks, bonds, cryptocurrencies, and other assets, can fluctuate both upwards and downwards. There is a significant risk of financial loss when buying, selling, holding, staking, or investing in these instruments. SQBE makes no recommendations regarding any specific investment, transaction, or the use of any particular investment strategy.
CFDs are complex instruments and come with a high risk of losing money rapidly due to leverage. The vast majority of retail client accounts suffer capital losses when trading in CFDs. You should consider whether you understand how CFDs work and whether you can afford to take the high risk of losing your money.
Digital Assets are unregulated in most countries and consumer protection rules may not apply. As highly volatile speculative investments, Digital Assets are not suitable for investors without a high-risk tolerance. Make sure you understand each Digital Asset before you trade.
Cryptocurrencies are not considered legal tender in some jurisdictions and are subject to regulatory uncertainties.
The use of Internet-based systems can involve high risks, including, but not limited to, fraud, cyber-attacks, network and communication failures, as well as identity theft and phishing attacks related to crypto-assets.
Wall Street's Billion-Dollar BNB Bet Fuels ATHBNB Ignites the Altcoin Market as Wall Street Giants Place Billion-Dollar Treasury Wagers
A perfect storm of technological advancement, surging institutional adoption, and bullish market sentiment has catapulted BNB into the stratosphere, setting the entire altcoin market alight. The native token of the sprawling BNB Chain ecosystem has not only shattered its previous all-time highs but is now the subject of unprecedented attention from major Wall Street players, who are lining up to pour billions into the digital asset. This confluence of factors has analysts and investors buzzing, with predictions of a continued explosive rally that could see BNB’s value enter uncharted territory in the coming months.
The price action has been nothing short of spectacular. In a powerful surge in late July 2025, BNB systematically broke through previous resistance levels, climbing to record peaks of over $860. This rally propelled its market capitalization to soar past $115 billion, a figure that eclipses that of established global giants like Nike. The move signaled more than just a momentary spike; it represented a fundamental repricing of the asset, driven by a narrative that has shifted from one of retail speculation to one of serious, long-term institutional conviction.
At the heart of this frenzy is a seismic shift in how traditional finance views BNB. The token is rapidly transitioning from a utility asset for a cryptocurrency exchange into a strategic reserve asset for corporate treasuries, following a path previously paved by Bitcoin. This new wave of "BNB Treasury" strategies is creating a structural demand floor and signaling a maturation of the asset class that few could have predicted just a few years ago.
The Institutional Stampede: A Billion-Dollar Bet on BNB
The most significant catalyst behind BNB’s recent ascent is the dramatic and public entry of institutional capital. A series of stunning announcements have revealed a coordinated and well-capitalized effort by publicly traded companies and investment firms to acquire substantial BNB holdings for their corporate treasuries.
Leading the charge is a landmark initiative by CEA Industries Inc., a Nasdaq-listed company, in partnership with the venture capital firm 10X Capital and with the backing of YZi Labs. The group announced an audacious plan to establish the world's largest publicly listed BNB treasury company. The strategy involves an initial $500 million private placement, comprised of $400 million in cash and $100 million in crypto. However, the full scope of the ambition is staggering: through the exercise of warrants, the total capital raised for the purpose of acquiring BNB could reach an astounding $1.25 billion.
This move is not being made in a vacuum. The deal has attracted a veritable who's who of institutional and crypto-native investors, with over 140 subscribers participating. The list includes heavyweights like Pantera Capital, GSR, Arrington Capital, and Blockchain.com, indicating widespread and sophisticated belief in the long-term value proposition of the BNB ecosystem. The leadership team for this new treasury venture further underscores its institutional credibility, featuring David Namdar, a co-founder of Galaxy Digital, and Russell Read, the former Chief Investment Officer of CalPERS, one of the largest public pension funds in the United States.
The CEA Industries and 10X Capital venture is the flagship of a growing armada of institutional interest. Before this headline-grabbing announcement, other companies had already signaled their bullish stance. Windtree Therapeutics, a biotech firm, disclosed it had secured $520 million through an equity line of credit to purchase BNB for its treasury. Similarly, the Nasdaq-listed Nano Labs expanded its own holdings to 128,000 BNB tokens, valued at over $100 million. Adding to the wave, Liminatus Pharma, another US-based biotech company, unveiled its own dedicated investment arm, the "American BNB Strategy," with the goal of deploying up to $500 million into BNB over time.
Collectively, these publicly announced plans represent more than $600 million in direct accumulation, with the potential for well over a billion dollars in buying pressure hitting the market. This institutional influx is fundamentally different from retail-driven rallies. These entities are not typically short-term traders; they are establishing long-term strategic positions. By allocating significant portions of their treasuries to BNB, they are effectively removing a large swath of the token's supply from the liquid market, creating a supply shock that can have a profound and lasting impact on price. This trend enhances BNB’s legitimacy, positioning it as a viable, institutional-grade reserve asset and providing a powerful new narrative for its continued growth. The market reaction to this news was immediate and explosive, not only for BNB but also for the companies involved. CEA Industries' stock (ticker: VAPE) skyrocketed over 600% in a single day, demonstrating the immense investor appetite for regulated, publicly-traded vehicles that offer exposure to the BNB ecosystem.
The Maxwell Upgrade: A High-Performance Engine for Growth
While the flood of institutional money has provided the high-octane fuel for BNB's rally, the engine driving its fundamental value has been meticulously upgraded. The recent "Maxwell" hard fork, implemented on the BNB Smart Chain (BSC) at the end of June 2025, represents a pivotal technological leap forward, dramatically enhancing the network's performance and scalability.
Named after the physicist James Clerk Maxwell, the upgrade was engineered to push the boundaries of blockchain efficiency. Its core achievement was the near-halving of the network's block time. Previously, BSC produced a new block approximately every 1.5 seconds; post-Maxwell, that interval has been slashed to a blistering 0.75 to 0.8 seconds. This move to sub-second block times effectively doubles the network's transaction speed and throughput.
For users, the impact is tangible and immediate. Transactions are confirmed faster, decentralized applications (dApps) feel more responsive, and the overall user experience is significantly smoother. Whether trading on a decentralized exchange (DEX), engaging with a DeFi lending protocol, or playing a blockchain-based game, the latency has been drastically reduced.
The Maxwell upgrade was not a simple tweak but a comprehensive overhaul powered by three key technical proposals:
1. BEP-524: This proposal was directly responsible for reducing the block interval, accelerating transaction confirmations and improving the responsiveness of dApps, making interactions in DeFi and GameFi feel closer to real-time.
2. BEP-563: With blocks being produced at twice the speed, the network's validators need to communicate and reach consensus much more quickly. This proposal enhanced the peer-to-peer messaging system between validators, strengthening the consensus process and reducing the risk of synchronization delays or missed blocks.
3. BEP-564: To further accelerate data synchronization across the network, this proposal introduced new message types that allow validator nodes to request and receive multiple blocks in a single, efficient message, ensuring the entire network remains stable and in sync despite the increased tempo.
The real-world impact of these technical improvements was almost immediate. In the month the Maxwell upgrade was rolled out, the 30-day decentralized exchange (DEX) volume on the BNB Chain soared to a record-breaking $166 billion. This figure surpassed the combined DEX volumes of major competitors like Ethereum and Solana, cementing BNB Chain's position as a leader in decentralized trading activity. PancakeSwap, the largest DEX on the chain, was a major beneficiary, handling the lion's share of this volume.
This surge in on-chain activity demonstrates a powerful feedback loop: technological enhancements attract more users and developers, which in turn drives up transaction volume and network utility, further increasing the value of the native BNB token. The Maxwell upgrade has solidified BNB Chain’s reputation as a high-performance, low-cost environment, making it an increasingly attractive platform for high-frequency traders, arbitrage bots, and a wide array of decentralized applications that demand both speed and reliability. The upgrade has also been credited with a significant increase in user engagement, with active addresses on the network surging 37% in the 30 days following its implementation, a growth rate that starkly outpaced competitors.
How High Can It Go? Analysts Eye $2,000 Cycle Top
With institutional floodgates opening and the network’s underlying technology firing on all cylinders, the question on every investor's mind is: how high can BNB price go? Market analysts are increasingly bullish, with many seeing the recent all-time highs as merely a stepping stone to much loftier valuations.
A price target of $1,000 is now widely considered a conservative short-to-medium-term goal. Some technical analysts, looking at the price charts, see a clear path to this milestone, potentially as early as August 2025. They point to BNB’s price action within a long-term ascending channel, with the upper trendline of this channel suggesting a target near the $1,000 mark. This level also aligns with key Fibonacci extension levels, adding technical weight to the prediction.
Beyond the four-figure mark, some of the most compelling forecasts come from analysts studying historical chart patterns, or "fractals." Market analyst BitBull, for instance, has drawn parallels between the current market structure and a pattern observed between 2018 and 2021. During that period, BNB’s price consolidated within a large ascending triangle pattern before breaking out and embarking on a monumental 920% rally. A similar multi-year ascending triangle has just seen a decisive breakout, suggesting history may be poised to repeat itself.
Based on this fractal analysis, BitBull projects a potential cycle top for BNB in the range of $1,800 to $2,000, which could be reached by early 2026. The analyst notes that even if the current rally only captures a fraction of the momentum seen in the previous cycle, a move past $1,000 by the end of the year seems highly plausible. A more aggressive interpretation of the ascending triangle breakout even suggests a speculative target as high as $3,900, though such a move would depend on ideal market conditions.
The derivatives market is also flashing bullish signals, reinforcing the positive sentiment. Open interest in BNB futures contracts—the total value of all active positions—has surged to an all-time high of over $1.7 billion. This indicates that a growing amount of capital is being deployed to bet on the future direction of BNB's price. Furthermore, funding rates have turned positive, meaning traders with long positions are willing to pay a premium to maintain their bullish bets, a sign of strong conviction in continued upward momentum.
This combination of fundamental drivers—soaring institutional demand and a supercharged network—along with bullish technical patterns and derivatives market activity, creates a powerful case for a sustained and significant appreciation in BNB's value. While the crypto market remains inherently volatile and no outcome is guaranteed, the confluence of positive factors currently surrounding BNB is undeniable. The token has set the altcoin market abuzz, not just by reaching new price peaks, but by fundamentally redefining its role in the digital asset landscape, transforming from a simple utility token into a cornerstone of Wall Street's burgeoning crypto treasury strategies. The journey into price discovery has just begun.
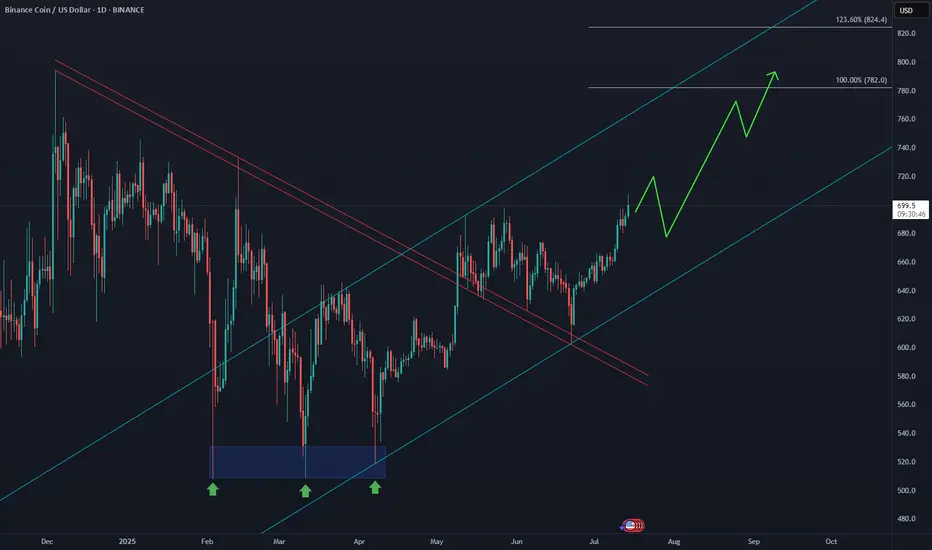
BNB to $1000?The BINANCE:BNBUSDT price structure suggests a move toward the $1,000 level during early 2026, which aligns with the upper boundary of the ascending channel.
read more at: www.cointrust.com

BINANCE COIN (BNBUSD): Bullish Continuation Ahead
BNB is going to resume growth after a retest of a recently broken structure.
A bullish breakout of a resistance line of a bullish flag provides a strong bullish confirmation.
I think that the price will go up to 844 level.
❤️Please, support my work with like, thank you!❤️

Elliot Wave Weekly timeframe $BNBUSD Simulated Elliot Wave Weekly timeframe for $BNBUSD.
Looking for top Wave 3 before next pullback.

BNBUSD – Calm Trend, Watch the DipBNB remains clean and trend-respecting. After touching $804, it’s pulling back orderly with RSI cooling to 52.38. Price still above the 200 SMA and no structural damage is seen. A hold above $786 keeps the trend LONG. A move below $780 flips momentum briefly, but no reversal yet.
BNBUSD – Holding Flat, But HeavyBNB has been grinding sideways, unable to reclaim above $830–$835. Price is compressing around the 200 SMA with weakening RSI momentum. Structure remains choppy with lower highs. Bulls need a close above $832–$835 to revive momentum, or this likely rolls lower to $815 again.

BNBUSD – Bull Lost the GripBNB printed a lower high near $705, then broke trend support near $695. A slow grind lower followed with minor bounces failing to reclaim key levels. Price now sits near $675 and shows bearish lower highs and descending structure. Watch $672–675 for bounce or breakdown — reclaim of $685 needed to turn bullish.

BNB Aiming for New All-Time Highs📈 After breaking above the May peak, CRYPTOCAP:BNB has activated a bullish sequence, with the equal legs target zone projected at $782–$824. This aligns with Elliott Wave extensions and confirms strong momentum from the June lows.
BNB/USD Trend Summary
1. Recent Price Action & History
BNB is consolidating around $660–$690, recently hitting a 52‑week high near $793 in May, with a 24‑hour range between $668–$687
Nasdaq
+14
TradingView
+14
CoinDCX
+14
.
Over the past month, it’s gained ~2–3%, with an uptick of ~4% in late June
CoinLore
+3
TradingView
+3
changelly.com
+3
.
2. Technical Setups Supporting Uptrend
Descending wedge breakout on 4‑hour chart, with targets around $697–710, then resistance at $728
TradingView
+2
CoinDCX
+2
tradinglounge.com
+2
.
Bullish flag & inverse H&S patterns suggest continuation toward $750–800+ .
Elliott Wave count shows corrective Wave ② ending near $633, projecting a Wave ③ rise; invalidation if drops below $597
TradingView
+2
tradinglounge.com
+2
TradingView
+2
.
Support zones holding firm at $648–637 and $608–592 .
3. Key Indicators
Price is above short‑ & mid‑term EMAs, waiting for hold above the 100/200‑day EMA confluence (~$612)
tradinglounge.com
+3
Iconomi
+3
CoinDCX
+3
.
The Stochastic RSI is overbought, risks a short consolidation before next leg .
🎯 Trade Analysis & Recommendation
You mentioned TP = 781, SL = 610. Here's an aligned plan:
Aspect Details
Entry After retracement into $648–660 or break above $690
Stop Loss (SL) Place around $610–$597 (key support/invalidation zone)
Take Profit (TP) Primary: $750–781 zone; beyond that, targets near $800–$830 plausible
Risk Management Risk ~5%, expect consolidation before breakout
🧭 Summary
Bullish stance justified — price structure supports uptrend, with clear technical triggers and historical momentum. Watch $648–637 and $610–597 as critical levels for pullback and stop placement. If BNB stays above those, chance of hitting your $781 TP is solid, with upside potential beyond.
Bottom Line:
Go long on consolidation pullback or breakout above ~$690
SL: ~$610 (or conservative $597)
TP: initial $781, trailing into $800+ if momentum continues
Tailor position size for acceptable risk and monitor EMA/RSI for signs of exhaustion.

$BNB Chart Showing Bullish Flag Pattern and Price Will Hit +$750CRYPTOCAP:BNB Previously Chart showing Bullish Inverse Head and Shoulder Pattern and Gain Profit of Range. It's a Reversal Pattern .
Now Chart Showing a Bullish Flag Pattern and it's Continuation Pattern. Time to Bullish for BNB Coin for FOMC 10th July Thursday 2025.
The upsloping 20-day EMA and the RSI just above the midpoint indicate a slight edge to the bulls. If the $665 resistance falls, the BNBUSD pair could rise to $675 and then to $698.
Sellers are likely to pose a solid challenge at $698 because a break above it could propel the pair to $732. I'm guess BNB Price Breakout of ATH and $888 Mystery will Happen.
This optimistic view will be negated in the near term if the price turns down and breaks below the moving averages. The pair may then drop to $636.
NEWSBTC: BNB Price Gears Up for Upside Break — Will Bulls Deliver?
BNB price is gaining pace above the $650 support zone. The price is now showing positive signs and might aim for more gains in the near term.
BNB price is attempting to recover from the $620 support zone.
The price is now trading above $655 and the 100-hourly simple moving average.
There is a key contracting triangle forming with resistance at $662 on the hourly chart of the BNB/USD pair (data source from Binance).
The pair must stay above the $655 level to start another increase in the near term.
BNB Price Eyes More Gains
After forming a base above the $620 level, BNB price started a fresh increase. There was a move above the $645 and $650 resistance levels, like Ethereum and Bitcoin.
The price even surged above the $660 level. A high was formed at $666 before there was a downside correction. The price dipped below the 50% Fib retracement level of the upward move from the $650 swing low to the $666 swing high.
The price is now trading above $655 and the 100-hourly simple moving average. On the upside, the price could face resistance near the $662 level. There is also a key contracting triangle forming with resistance at $662 on the hourly chart of the BNB/USD pair.
The next resistance sits near the $665 level. A clear move above the $665 zone could send the price higher. In the stated case, BNB price could test $672. A close above the $672 resistance might set the pace for a larger move toward the $680 resistance. Any more gains might call for a test of the $700 level in the near term.
Another Decline? If BNB fails to clear the $662 resistance, it could start another decline.
Initial support on the downside is near the $655 level and the 61.8% Fib retracement level of the upward move from the $650 swing low to the $666 swing high. The next major support is near the $650 level.
The main support sits at $644. If there is a downside break below the $644 support, the price could drop toward the $632 support. Any more losses could initiate a larger decline toward the $620 level.
Technical Indicators
Hourly MACD – The MACD for BNB/USD is gaining pace in the bullish zone.
Hourly RSI (Relative Strength Index) – The RSI for BNB/USD is currently above the 50 level.
Major Support Levels – $655 and $650.
Major Resistance Levels – $662 and $665.
#Write2Earn #BinanceSquareFamily #BinanceTurns8 #BNB #SUBROOFFICIAL
Disclaimer: This article is for informational purposes only and does not constitute financial advice. Always conduct your own research before making any investment decisions. Digital asset prices are subject to high market risk and price volatility. The value of your investment may go down or up, and you may not get back the amount invested. You are solely responsible for your investment decisions and Binance is not available for any losses you may incur. Past performance is not a reliable predictor of future performance. You should only invest in products you are familiar with and where you understand the risks. You should carefully consider your investment experience, financial situation, investment objectives and risk tolerance and consult an independent financial adviser prior to making any investment.

BNBUSD – Squeeze or StallBNB ripped into $668 and formed a tight double top before dropping into $653. It then coiled between $656–$664 for hours. The recent spike shows a breakout attempt, but needs to hold above $662 for bulls to confirm control. Otherwise, this is just another pop to sell.

BNB Stuck in Barrier Triangle?CRYPTOCAP:BNB appears to be in a macro wave 4 barrier triangle, and for some time.
It has held up particularly well during the alt coin massacre, not even reaching the .382 Fibonacci retracement.
Price is testing the upper boundary for the 4th time, that starts to give us the higher probability breakout which increases with each test. The daily 200EMA and pivot were tested as support successfully.
Safe trading.

BNBUSD – Break or Burn OutBNB ran explosively into the $666–$668 zone, but was quickly met with heavy distribution. A selloff followed, driving price back to $654 before forming a rounded base. Price has now recovered into the $662–$664 area but is consolidating in a tight range. Bulls must clear $665 to regain momentum. Otherwise, signs point to fatigue.

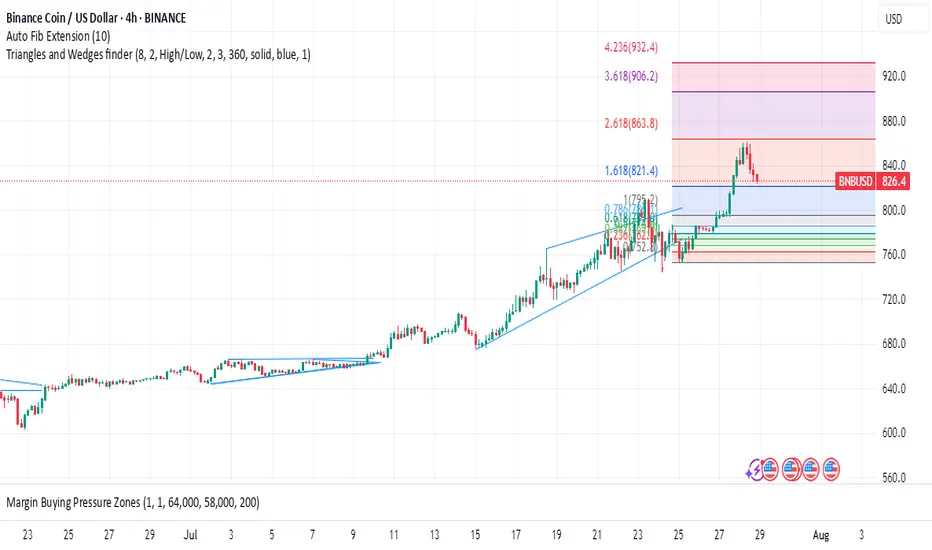
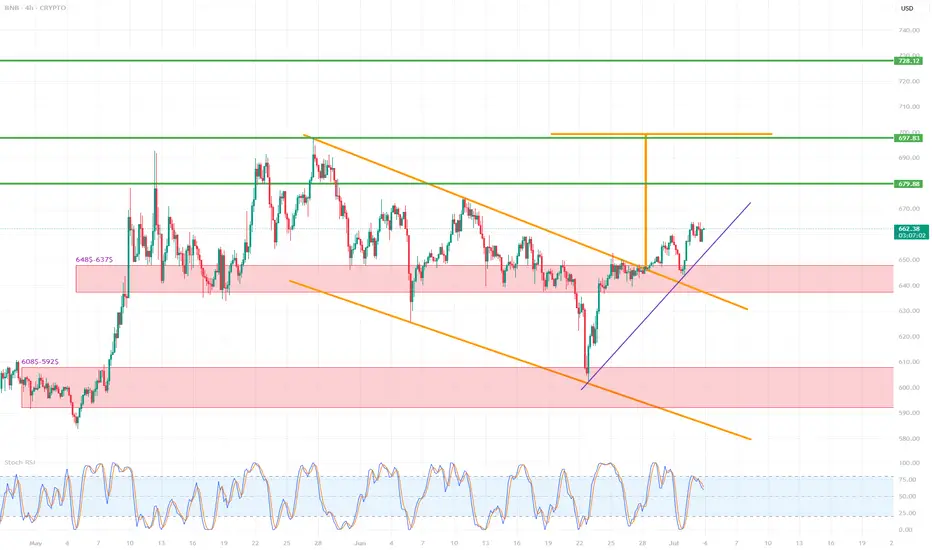
BNB/USD (4h interval)🔍 1. Chart structure
Instrument: Binance Coin / USD (BNB/USD)
Interval: 4 hours
📐 2. Technical formations
🔸 Breakout from the descending wedge formation
The descending wedge (orange lines) is a bullish formation - it suggests a potential breakout upwards.
The breakout occurred dynamically, with a large breakout candle (confirmation of the formation).
The goal of breaking out of the wedge is usually the height of the entire formation - this is marked with an orange arrow.
📈 Breakout range (target): around $697–710
🟢 Potential next targets:
697.83 (local resistance/projection result)
710.73 (main wedge height projection)
728.12 (strong resistance from history)
📊 3. Supports and resistances
🟥 Support zones (red rectangles):
$648.5–637.5 – previous resistance, now tested as support after the breakout.
$608.5–592.5 – strong support from previous lows.
🔼 Currently, the price has tested the upper support zone (648–637), reacted positively and continues to move up.
🟩 Resistance levels (green horizontal lines):
679.88 USD – local resistance, first target after breaking out of the wedge.
697.83 USD – projected range from the formation.
710.73 USD – full technical range of the breakout.
728.12 USD – strong resistance from history, may be a long-term target.
📉 4. Trends and support lines
Purple upward trend line – currently the price is above, which confirms the short-term upward trend.
Its break may lead to a retest of 648–637 USD.
Only below this zone can a larger correction be considered.
📈 5. Stochastic RSI indicator
Currently in the overbought zone (above 80).
Possible temporary cooling – signal for local correction / consolidation.
It is worth waiting for the indicator to go down to around 20 to re-enter the long.
✅ 6. Scenarios
🔼 Bullish (base) scenario:
Staying above 648–637 USD.
Maintaining the uptrend line.
Continuation to 679.88 → 697.83 → 710.73.
🔽 Bearish scenario:
Breaking the purple trend line.
Returning below 648 USD → going down to the 608–592 zone.
Negation of the breakout from the wedge.
📌 Final conclusions
Breaking out from the descending wedge is a strong pro-growth signal.
The price behaves in accordance with technical analysis, testing the previous resistance as support.
Currently, the retest and consolidation phase is underway – maintaining the trend line and the level of $648 will be key.
The medium-term target is $697–710.
BNBUSD Bullish BNBUSD Analysis Update
Price has already mitigated the Fair Value Gap (FVG), and we are now anticipating a potential mitigation of the nearby Order Block (OB). On the Daily Chart, a bullish flag pattern is clearly in play, with the structure showing a confirmed third touch. We’re currently testing the upper trendline, which is acting as key resistance.
Watching closely for a breakout or possible rejection from this level.
#BNBUSD #SmartMoney #OBMitigation #BullishFlag #TechnicalAnalysis #TradingView
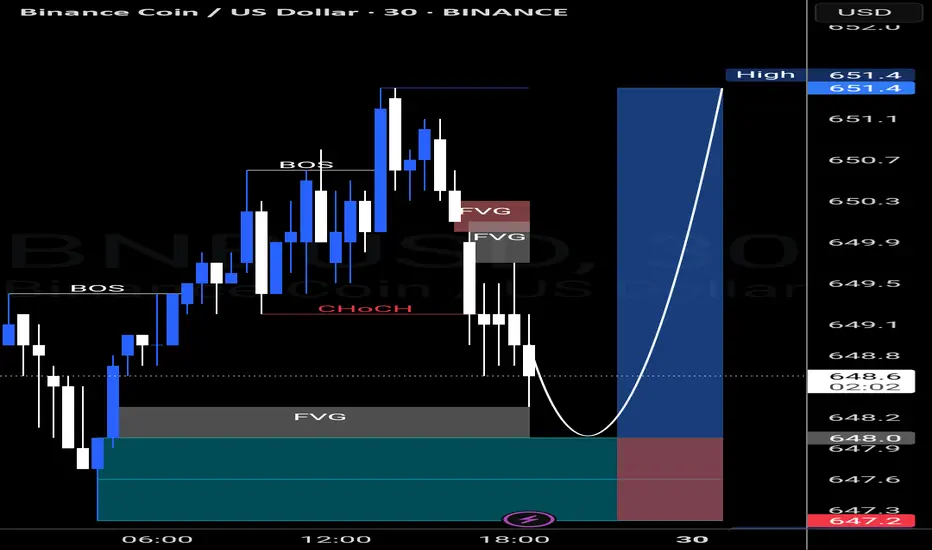
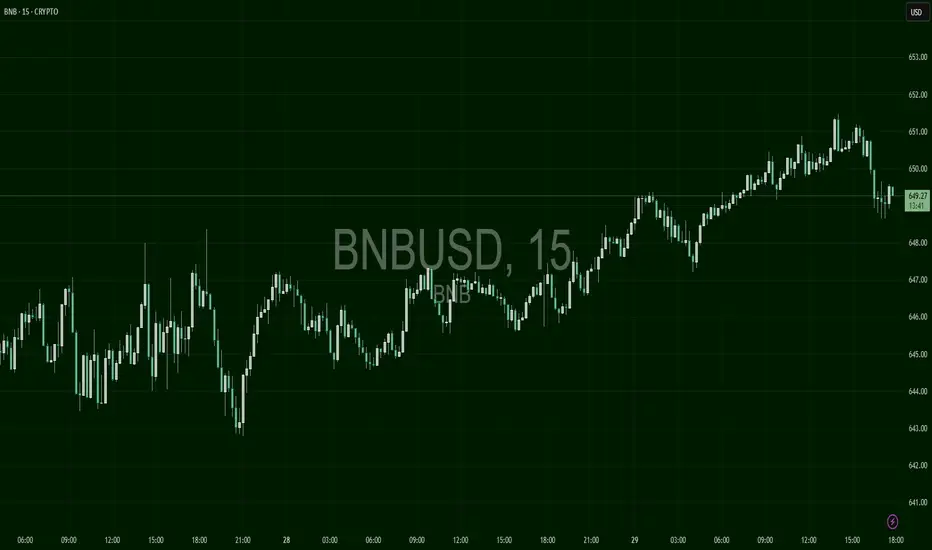
BNBUSD – Inverse Head & Shoulders PlayBNB formed a messy inverse head-and-shoulders structure with neckline at $649. After multiple rejections, it finally broke through and is holding above. Now consolidating just under $651, preparing for the next leg. Entry above $651 confirms continuation, while falling below $648 invalidates the bullish case.
BNB Double Correction Hits Extreme ZoneBINANCE:BNBUSD has now entered the Blue Box buying area, signaling the final phase of the correction. A weekly reversal confirmation is the next key step — once that’s in place, the bounce phase is expected to begin.

BNB Holds $649 Floor, but Momentum FadesBNB is attempting to hold above $649 after a volatile recovery. Despite a solid bounce from sub-$645, price has flattened, indicating consolidation or fading interest at current levels.

BNB Pauses After Rally to $674BNB saw a continued uptrend into $674 before pulling back toward $657. The strong rally lost steam, forming a possible lower high. Momentum has slowed slightly, suggesting a consolidation or retracement phase.
