Binance Coin (BNB): Might Go For Another Touch!We are back with Binance coin after that fakeout movement near EMAs (from last TA). We got a nice small 10% market price movement, but nothing too big.
Price went back for bullish movement, reclaiming again EMAs and going for a potential re-test of upper resistance.
We will be looking for that zone there for any possible rejection and a good entry as well!
Swallow Team
BNBUSDT.P trade ideas
Bullish on BNBPrice coming from Daily demand and took out the liquidity on H1 and now ready to target upside buyside liquidity.

BNB primed for lift-offBNB primed for lift-off! 🚀📈 Riding the Elliott Wave on the 1M TF to new heights! 🌟💼 Are you ready for the bullish journey ahead? 🔥💰 #CryptoTrading #ElliottWaveTheory #ToTheMoon"

$BNB #Binance Trading IdeaBNB/USD (Binance) is still forming an ascending triangle pattern, with huge potential to break its all-time high level. The ATH price is around $692.6. Am I right? After crossing this line, it will start exploring new price targets in that uncharted territory.

Is Binance Coin breaking out of its bearish pattern?According to the buying pressure in the market, if the $590 range is broken and the price stabilizes, the price may increase to the $615 range, and if the price is strong, it will reach the $630 range.
Otherwise, the price may fall to the range of $555.

BNBUSDT - Price can break resistance level inside rising channelHi guys, this is my overview for BNBUSDT, feel free to check it and write your feedback in comments👊
Recently price entered to falling channel, where it soon broke resistance level, which coincided with resistance area.
After this, BNB reached resistance line of channel and then bounced down to support line, breaking $604 level again.
Then price made downward impulse, exiting from falling channel and breaking $560 level.
But then, BNB turned around and started to grow inside rising channel, where it broke $560 level again and continued to grow.
Later price reached resistance line of channel, but at once bounced and fell to support line, where now it continues to trades near.
In my mind, Binance Coin can bounce up from support line of channel to $615, breaking resistance level.
If this post is useful to you, you can support me with like/boost and advice in comments❤️

Symmetrical TriangleWait for breakout and breakdown, manage your trade according to your portfolio. Thank you

BNBUST | Short H4 | Market Exec |Technical Confluences for Trade:
- Stochastics are in Overbought Conditions on H4 time-frame
- Price action is close to a Resistance Trendline & a Consolidation are
- Price action may reverse back towards the previous Demand Zone
Suggested Trade:
Entry @ Area of Interest 560 - 570
SL @ 580.66
TP 1 @ 552 (Close Half-Position & move SL to Entry level once TP1 is achieved)
TP 2 @ 535.15
Risk-to-Reward @ Approx. 2.18 (Depending on Entry Level)
________________________________
Boosts 🚀, Follows ✌️, Shares 🙌 & Comments ✍️ are much appreciated!
If you have any ideas or charts, do share them in the 'Comments' section below and we can discuss our perspectives to improve or strengthen our strategies.
If you want something analyzed, do drop me a DM. :D
________________________________
Disclaimer: The above suggestion is an personal opinion in general and does not constitute as investment advice. Any decisions taken based on the above suggestion is purely your own risks.
Any websites / brokers / applications suggested here are also provided as informational purpose only.
________________________________

Chart 3 of 5: BNBUSDT BULLISH RECTANGULAR CONT.PATTERNBNB is in a bullish rectangular continuation pattern and trading in a range between 497 and 645 which most probably going to go rise as per technical formation. A buy stop order at break of current resistance will be most appropriate.

HelenP. I Binance Coin will continue to grow to $605 pointsHi folks today I'm prepared for you Binance Coin analytics. Some days ago price entered to consolidation, where it first rose to the resistance level, which coincided with the resistance zone, and then at once rebounded from to support level. After this movement, BNB turned around and made an impulse up to the resistance zone, after which it in a short time declined to the trend line, thereby exiting from consolidation and breaking 620 with 550 levels. Then the price turned around and rose higher than the 550 level, breaking it again, but soon fell back to the trend line, after which BNB made impulse up to almost the resistance level, finally breaking the 550 level. After this movement, Binance Coin turned around and in a short time declined to the trend line, breaking this line and fell to the support zone, after which it not a long time ago exited up, and now price trades near the trend line. For my mind, Binance Coin will little correct and then the price can continue to move up. That's why I set my target at 605 points. If you like my analytics you may support me with your like/comment ❤️

BNB analysis I drew my points on the chart. The ascending trend line is broken and we have 600$ support. If 600 breaks downward we're going down to 570 then 550 and eventually 500 is the next stop

ALSO check BNBUSDT THIS CHART FOR GOOD MOVES..AND PROFITS..hello traders,
keep eyes on bnbusdt chart for capturing for making good profits..
check my bitcoin level or analysis for your bnb views..
bitcoin chart helps you for the next move in (bnbusdt) if you want to make good profiys...
AND FOLLOW MY PAGE FOR UPDATES OF CRYPTO..

BNBUSDTWe can attempt to short BNBUSDT from specified level if it break last HL , also there is bearish divergence indicate that it move downward.
SL , TP mention in chart.

BNBUSDT - trading in the rangehi traders
Let's take a look at BNBUSDT.
The chart is very self-explanatory.
Buy at the bottom of the range and sell at the top of the range.
Expecting the support to hold and give traders a chance to buy at the support again.
If support fails, it may go much lower, so don't forget to put a stop loss !
Good luck

BNB/Binance Coin - Harmonic Pattern AnalysisBNB Harmonic Pattern Analysis
BNB recently completed a large harmonic pattern on the 4-hour time frame.
This pattern was completed near 618.
The harmonic pattern signals the potential for a deeper correction.
Traders should be cautious as it suggests a potential downtrend.
A minor bearish zone is identified around 592.
Target Zones: The normal target zones for this pattern are located near 578 and 553.
These levels are crucial for traders to watch closely.
Considering the daily chart, there is a possibility that the price may decline further to around 510 in the coming weeks.
You may find more details in the chart!
Thank you and Good Luck!
❤️PS: Please support with a like or comment if you find this analysis useful for your trading day❤️

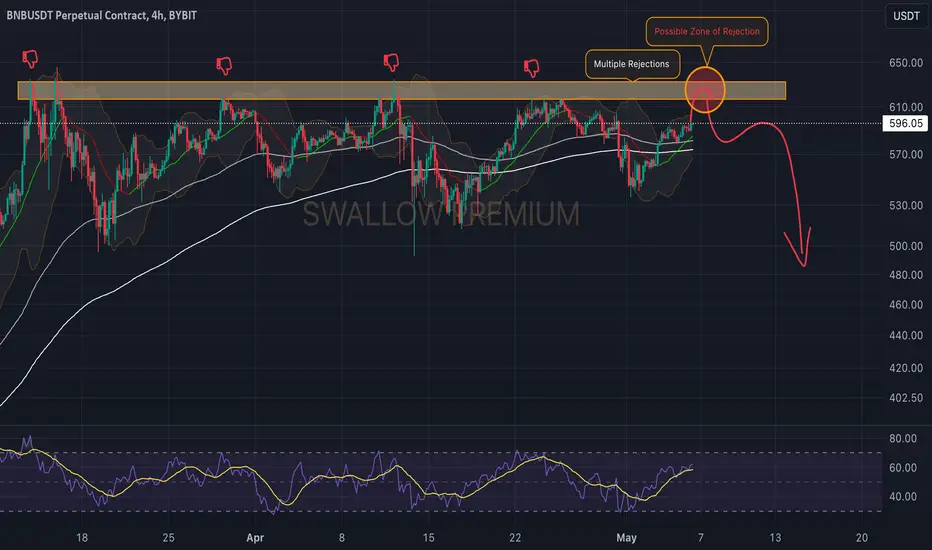
Binance Coin(BNB): Looking For ShortWe are monitoring the push on Binance Coin, where the price is going towards that upper resistance zone.
While it is early to say, we are looking for a rejection, and if we see one, we will be looking at a good downward movement towards 100 & 200 EMAs.
Swallow Team
