Lingrid | BNBUSDT breakout Setup. Preparing for Bullish Surge? BINANCE:BNBUSDT is facing strong resistance below the red descending trendline, repeatedly forming lower highs as it struggles to break above 650. The price is coiling between the 636 and 648 zones, hinting at a potential breakout or breakdown move. A clean rejection could drag price back to the 60
Related pairs

BNB Price Today: Downtrend Ends As Bullish Momentum Strengthens
BNB is currently priced at $658 , showing resilience despite market volatility. However, it’s facing a micro downtrend this month. The positioning of the exponential moving averages (EMAs) below the candlestick indicates a potential bullish trend.
This pattern suggests that if BNB can maintain i

BNB/USDT 1D🕵️♂️ General context
• Steam: BNB/USDT
• Price: 649.52 USDT
• Time: 1D (daily interval)
• Currently, the reflection is underway after the inheritance, but the technical situation remains uncertain.
⸻
📈 Trend and market structure
• You can see a previous strong drop (visible long red c

BNB to Make History Before 2026 BeginsCRYPTOCAP:BNB is setting up for something big. Price is holding strong above the rising support line, with the 50 EMA acting as dynamic support.
It's consolidating just below the all-time high — a classic sign of strength. Structure looks solid, momentum is building, and the chart favors bulls.

BNB USDT LONG TRADE SETUPBNB/USDT is currently holding at a strong support zone, with a high probability of an upward price move. Also EMA 200 acting as a support for BNB.

Binance Coin (BNB): Breakout Happening, $800 IncomingBNB coin has had a nice breakout recently, breaking from the local resistance trend, and now we are seeing some sort of weakness kicking in. Ideally we should see a proper retest of that broken zone target will remain the same for us here, $800.
Swallow Academy

HolderStat┆BNBUSD came out of the wedgeBINANCE:BNBUSDT just cleared a multi-week wedge resistance, signaling a bullish breakout above $635. The price is now poised to retest the upper channel boundary near $700–730. If bulls maintain momentum, this breakout could mirror prior impulsive legs higher, especially following similar consolida

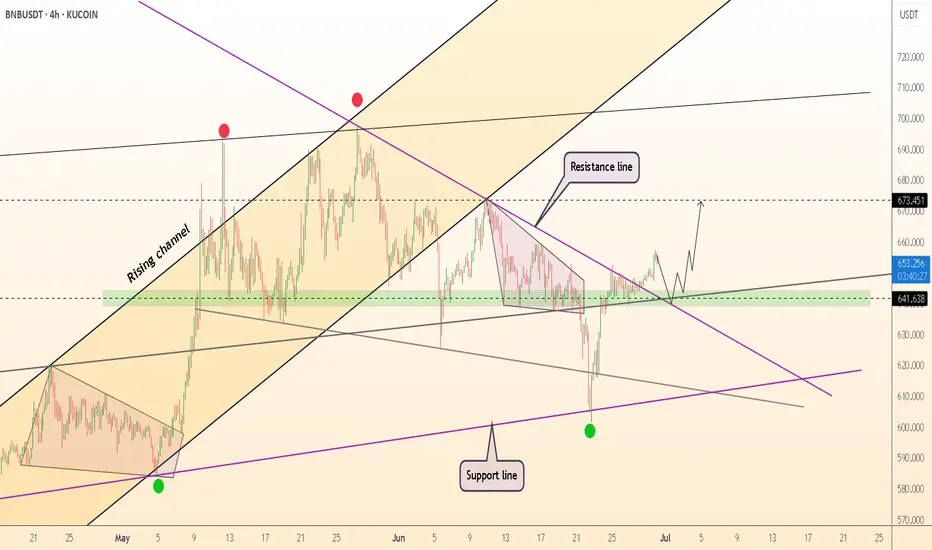
DeGRAM | BNBUSD broke the resistance line📊 Technical Analysis
● Breakout: price pierced the purple descending resistance, retested it and the green $641-648 demand cluster, then bounced—confirming the breakout as valid support.
● Rising channel intact; higher-low sequence points to the mid-band confluence at $673. A measured move from th
BNBUSDT Forming Bullish Wave BNBUSDT is forming a promising bullish wave pattern that suggests a potential continuation of the upward trend in the short to mid-term. The structure is supported by consistent volume, indicating strong participation and interest from traders and investors. The price action reflects healthy higher

HolderStat┆BNBUSD forming the falling wedgeBINANCE:BNBUSDT on the 8h chart rebounded from a falling wedge and reclaimed the $630 support. Price structure shows growing strength as it aims for $680 next. Watch for a breakout confirmation to ignite a push toward $740.

See all ideas
Summarizing what the indicators are suggesting.
Oscillators
Neutral
SellBuy
Strong sellStrong buy
Strong sellSellNeutralBuyStrong buy
Oscillators
Neutral
SellBuy
Strong sellStrong buy
Strong sellSellNeutralBuyStrong buy
Summary
Neutral
SellBuy
Strong sellStrong buy
Strong sellSellNeutralBuyStrong buy
Summary
Neutral
SellBuy
Strong sellStrong buy
Strong sellSellNeutralBuyStrong buy
Summary
Neutral
SellBuy
Strong sellStrong buy
Strong sellSellNeutralBuyStrong buy
Moving Averages
Neutral
SellBuy
Strong sellStrong buy
Strong sellSellNeutralBuyStrong buy
Moving Averages
Neutral
SellBuy
Strong sellStrong buy
Strong sellSellNeutralBuyStrong buy
Displays a symbol's price movements over previous years to identify recurring trends.
Curated watchlists where BNBUSDT is featured.

Interest-earning crypto wallets: Put your digital money to work
12 No. of Symbols

Proof of Stake: Seeking validation?
26 No. of Symbols
See all sparks
Frequently Asked Questions
The current price of Binance Coin / USDT (BNB) is 657.54 USDT — it has fallen −0.48% in the past 24 hours. Try placing this info into the context by checking out what coins are also gaining and losing at the moment and seeing BNB price chart.
Binance Coin / USDT price has risen by 2.81% over the last week, its month performance shows a −0.18% decrease, and as for the last year, Binance Coin / USDT has increased by 18.03%. See more dynamics on BNB price chart.
Keep track of coins' changes with our Crypto Coins Heatmap.
Keep track of coins' changes with our Crypto Coins Heatmap.
Binance Coin / USDT (BNB) reached its highest price on Jun 11, 2025 — it amounted to 2,764.15 USDT. Find more insights on the BNB price chart.
See the list of crypto gainers and choose what best fits your strategy.
See the list of crypto gainers and choose what best fits your strategy.
Binance Coin / USDT (BNB) reached the lowest price of 6.38 USDT on Mar 13, 2020. View more Binance Coin / USDT dynamics on the price chart.
See the list of crypto losers to find unexpected opportunities.
See the list of crypto losers to find unexpected opportunities.
The safest choice when buying BNB is to go to a well-known crypto exchange. Some of the popular names are Binance, Coinbase, Kraken. But you'll have to find a reliable broker and create an account first. You can trade BNB right from TradingView charts — just choose a broker and connect to your account.
Crypto markets are famous for their volatility, so one should study all the available stats before adding crypto assets to their portfolio. Very often it's technical analysis that comes in handy. We prepared technical ratings for Binance Coin / USDT (BNB): today its technical analysis shows the buy signal, and according to the 1 week rating BNB shows the strong buy signal. And you'd better dig deeper and study 1 month rating too — it's buy. Find inspiration in Binance Coin / USDT trading ideas and keep track of what's moving crypto markets with our crypto news feed.
Binance Coin / USDT (BNB) is just as reliable as any other crypto asset — this corner of the world market is highly volatile. Today, for instance, Binance Coin / USDT is estimated as 1.03% volatile. The only thing it means is that you must prepare and examine all available information before making a decision. And if you're not sure about Binance Coin / USDT, you can find more inspiration in our curated watchlists.
You can discuss Binance Coin / USDT (BNB) with other users in our public chats, Minds or in the comments to Ideas.