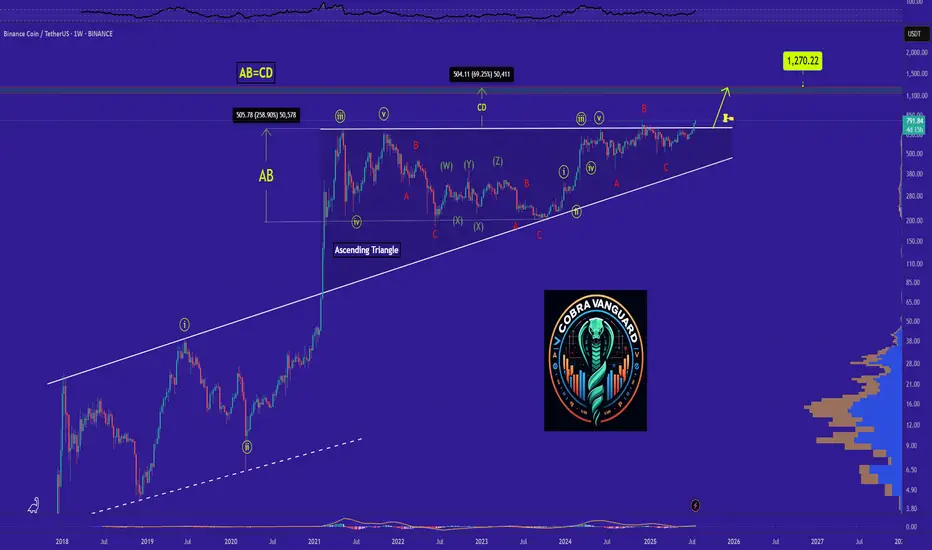
Why BNB Remains Bullish and Its Next Potential Move !Currently,is forming an ascending triangle, indicating a potential price increase. It is anticipated that the price could rise, aligning with the projected price movement (AB=CD).
previous analysis
Stay Awesome , CobraVanguard.
BNBUSDT trade ideas
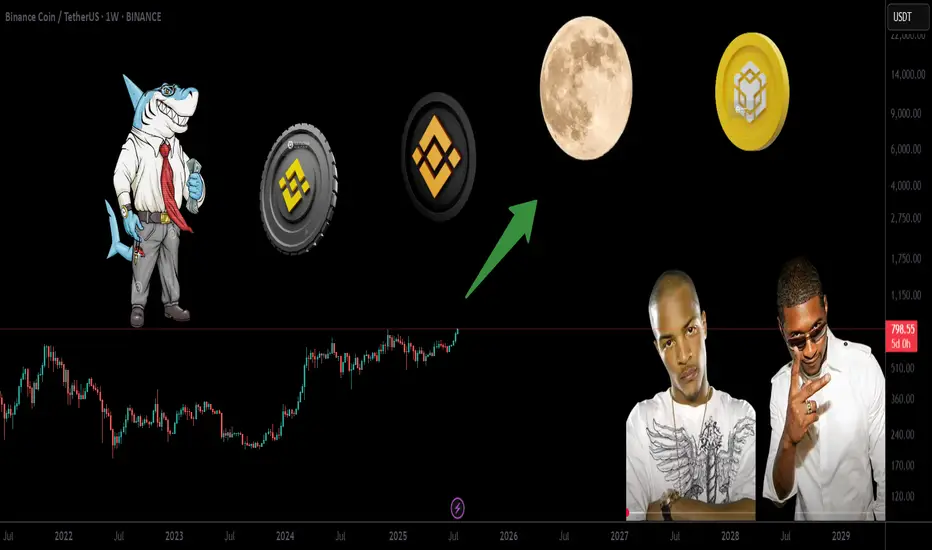
BNBUSDT - New ATH!"The strongest resistance level on the chart has just been broken — which was represented by the previous ATH — after nearly four attempts.
This exact pattern occurred before in 2021, and what followed was a parabolic rally.
The same scenario is unfolding now!
You’ll soon see BNB trading in four digit
When the crowd doubts — the smart money loads up.
Expect a parabolic rally once sentiment flips.
Best Regards:
Ceciliones🎯
BNB WEEKLYHello friends🙌
🔊We are here with BNB analysis:
A long-term analysis that can be viewed as an investment, but in the long term, with patience and capital management...
You can see that after weeks of price suffering, a good upward move has now been formed by buyers, which has also caused a new ceiling to be set. Considering the market decline and the decline of most currencies, you can see that BNB is well supported and its price has suffered.
⚠Now, with the arrival of buyers, you can enter a long-term buy trade with capital management.
🔥Follow us for more signals🔥
*Trade safely with us*

BNB 5 RR upside HVFBNB 5 RR upside HVF - continuation patterns over and over on BNB. Seeking the 900 mark after an 800$ break and new setup with fractals.
DeGRAM | BNBUSD above the support📊 Technical Analysis
● BNB is climbing a steep micro-channel nested in the long-term purple up-trend; the last dip stopped exactly at the $775 breakout shelf and printed a fresh higher-high, showing buyers still protect every pull-back.
● The old March resistance line has been broken and retested as support; its extension, plus the channel ceiling, converge at $835-840—matching the 1.618 flag-pole projection from July’s consolidation.
💡 Fundamental Analysis
● On-chain activity is surging: Yahoo Finance reports BNB Chain daily transactions and DEX volume just reached multi-month highs, underpinning spot demand.
✨ Summary
Long $775-790; hold above the green shelf targets $835 → $840. Invalidate on a 4 h close below $741.
-------------------
Share your opinion in the comments and support the idea with a like. Thanks for your support!

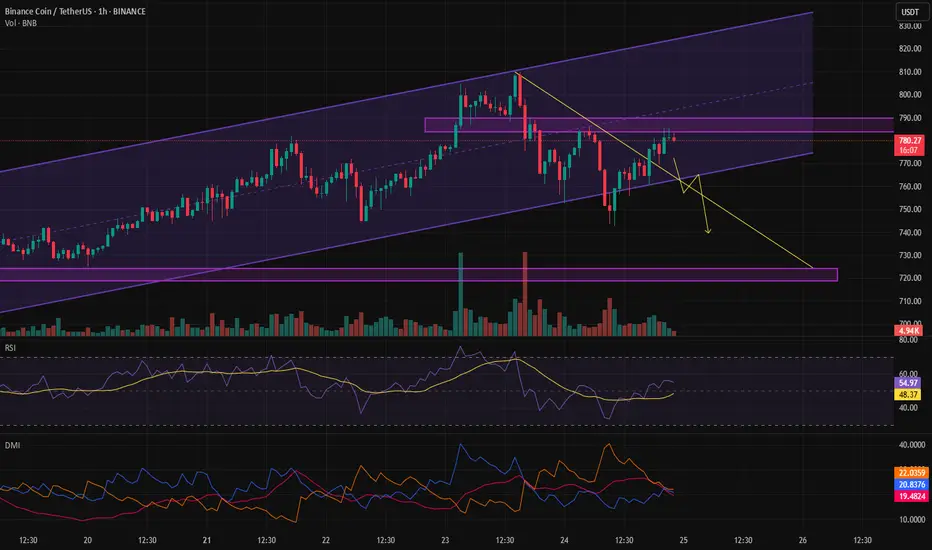
The sell signal is about to be triggered.Considering the weakness in the trend, if the price moves toward the bottom of the channel one more time, there's a possibility of the channel breaking to the downside.
Massive Breakout Coming for BNB? Eyes on 1250, 1700, 2300 LevelsHello✌
Let’s analyze Binance Coin’s upcoming price potential 📈.
BINANCE:BNBUSDT , I expect an upward bullish trend in the long term.
I have three main targets in this analysis: $1250, $1700, and a final target of $2300. These targets could potentially be reached over a period of 2 to 6 years.
The price may form parallel channels along the way, which are shown on the chart. I also expect the current upward bullish channel to remain valid throughout this movement.
✨We put love into every post!
Your support inspires us 💛 Drop a comment we’d love to hear from you! Thanks , Mad Whale🐋
🐋Many of the points and levels shown on the chart are based on personal experience, feeling, and over 7 years of research and daily study of crypto charts.
Some of the lines, channels, and price zones are drawn to make the chart easier to understand and to help imagine possible future price movements.
I’ve also included one very big drop in price even bigger than the others because in the crypto market, it’s common for prices to suddenly fall hard and push out small investors and traders with positions.
The targets on the chart are not guaranteed; they might be reached, or they might not.📚

Can BNB reach around $1000 ?...The BNB is in a ascending triangle now which means the price will increase and also It is expected that the price would at least grow as good as the measured price movement(AB=CD)
Note: we should wait for the breaking of the triangle and than make a move!
See my first anaysis on BNB in 2020
✨We spend hours finding potential opportunities and writing useful ideas, we would be happy if you support us.
Best regards CobraVanguard.💚
_ _ _ _ __ _ _ _ _ _ _ _ _ _ _ _ _ _ _ _ _ _ _ _ _ _ _ _ _ _ _ _
✅Thank you, and for more ideas, hit ❤️Like❤️ and 🌟Follow🌟!
⚠️Things can change...
The markets are always changing and even with all these signals, the market changes tend to be strong and fast!!

Here I buy Binance Coin at $800Here I buy Binance Coin at $800
buy orders starting at $800
sell orders getting filled
binance coin supply shock is getting triggered
right now. Time to make binance coin great again
if sardines are thinking im done with altcoins, they are dead wrong
there are many to be bought still
THE THIRD GUY
t.I usher baby
hey, hey
hey what's happenin e'erybody
i hope they get my good siiiiide
you know i gotta look good when i walk out the house
you know i know the camera's following
i know they taking pictures, right drama?
ay man you watch it I live it you dig that
yall sit back relax get some popcorn man
im gonna make it a good show you dig that
this goin make a helll of a movie huh
my life your entertainmeeeeeeeeeent
you watch while I live iiiiiiit
i walk they follow
i talk they holla
just here for your amusemeeeeent
my life you entertainmeeeeent
you watch while i live iiiiit
you wait for me to lose it
I guess i'm just here for your amusemeeent
"BNB Primed for a Pump – Thief Trading Mode Activated!"🚨 BNB/USDT HEIST PLAN – SWIPE THE BULLISH LOOT BEFORE COPS ARRIVE! 🚨
🌟 Attention, Money Makers & Market Robbers! 🌟
(Hola! Oi! Bonjour! Hallo! Marhaba!)
The BNB/USDT vault is CRACKED OPEN—time to execute the ultimate heist! 🏦💰 Based on 🔥Thief Trading Style Analysis🔥, here’s your lucrative robbery blueprint for the Binance Coin vs. Tether market.
🔐 MASTER PLAN: LONG ENTRY HEIST (HIGH-RISK, HIGH-REWARD)
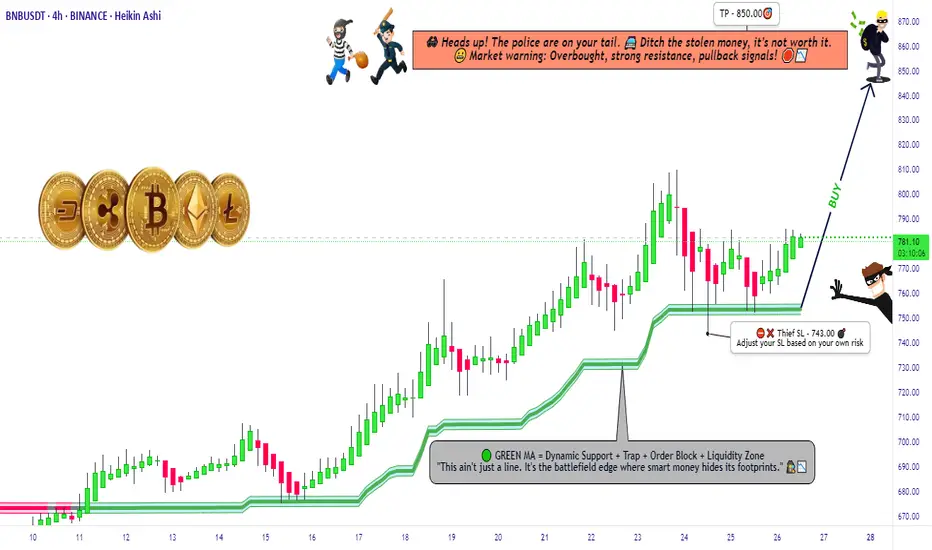
🎯 TARGET: 850.00 (or escape before the cops show up!)
🚨 POLICE TRAP ZONE: Overbought + Strong Resistance – Bears & cops are lurking!
💎 TAKE PROFIT EARLY & TREAT YOURSELF! (You’ve earned it, outlaw!)
⚔️ ENTRY STRATEGY: SWIPE FAST OR WAIT FOR THE PULLBACK!
🤑 VAULT IS OPEN! Enter any price if you’re bold (instant long).
🕵️♂️ SMART THIEVES: Use buy limit orders near 15M/30M swing lows/highs for a safer heist.
🛑 STOP-LOSS (ESCAPE ROUTE)
Thief SL: 743.00 (4H candle wick – adjust based on your risk tolerance!)
⚠️ WARNING: If the cops (bears) break in, DON’T HESITATE—RUN!
🎯 TARGETS & ESCAPE PATHS
Scalpers: Trail your SL & escape with quick loot! (Only long-side allowed!)
Swing Bandits: Hold strong but watch for police traps!
📡 MARKET INTEL (WHY THIS HEIST WILL WORK)
Bullish momentum in play! (But stay sharp—consolidation & reversals possible.)
Fundamentals, COT Reports, On-Chain Data, & Sentiment all hint at more upside!
🚨 TRADING ALERTS – DON’T GET CAUGHT!
📰 NEWS = VOLATILITY! Avoid new trades during major releases.
🔒 LOCK PROFITS! Use trailing stops to protect your stolen gains.
💥 BOOST THIS HEIST – STRENGTHEN THE SQUAD! 💥
🔥 Hit the LIKE & FOLLOW to support the robbery team!
🚀 More heists coming soon—STAY TUNED, OUTLAWS! 🚀
🎯 Trade Smart. Steal Big. Escape Faster. 🏴☠️
BNB Breaks ATH – Just Like I PredictedBNB ATH Breakout – Just As Predicted 🚀
A few days ago, I said it loud and clear:
"Mark my words — BNB will not only retest its ATH but break it and go beyond before the year ends."
Well... today, it happened.
BNB just smashed through its previous ATH and printed a new all-time high, exactly as charted.
Strong structure ✅
EMA support held ✅
Momentum built up ✅
Bulls showed up ✅
This is what conviction backed by TA looks like.
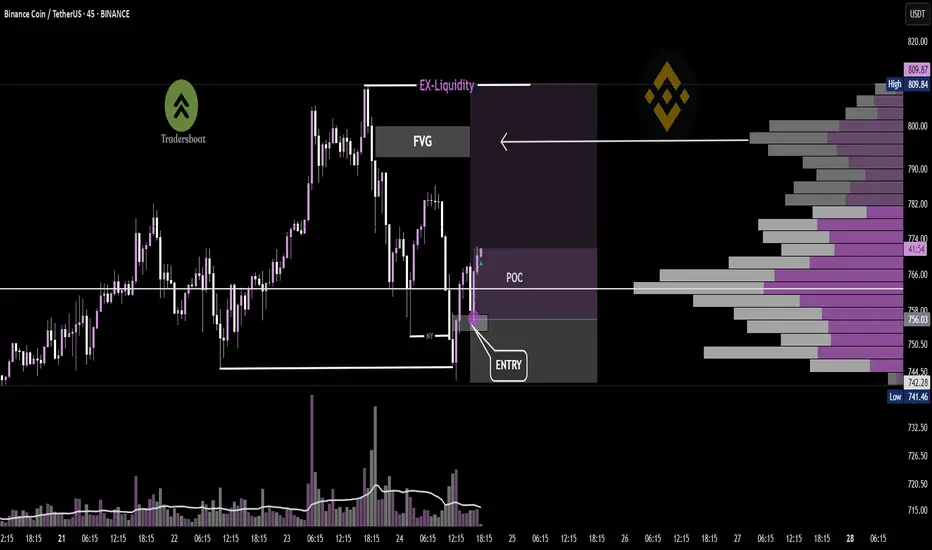
BNB/USDT - 45MIN Reversal in PlayPrice swept the New York session low, tapping into a key POC zone. A strong bullish engulfing candle followed, signaling potential reversal from demand. With momentum building, the setup targets the recent external liquidity above near FVG highs — a classic SMC bounce play.🔁
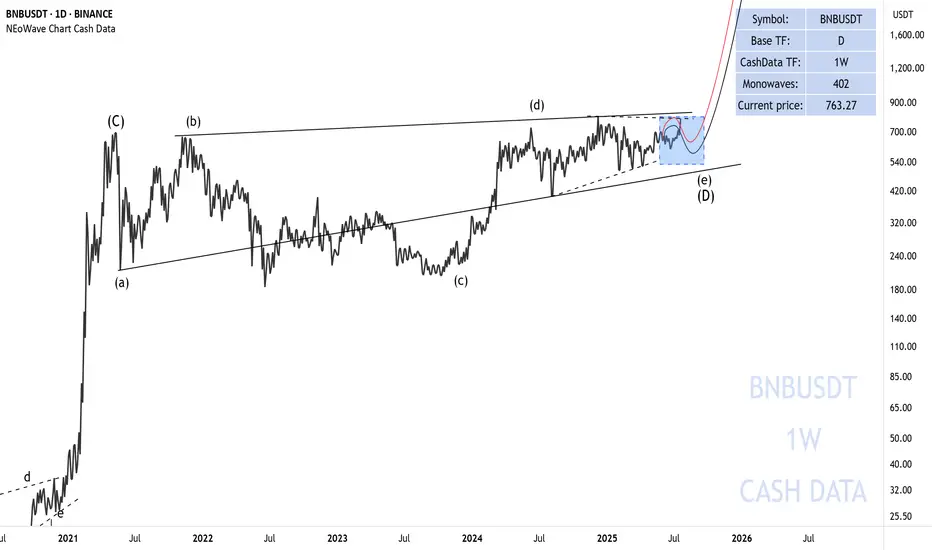
BNB is getting ready to riseThe first bullish move I was expecting for BNB has taken place and it looks like we should be waiting for the formation of wave-e of (e).
After the completion of wave-(e), we expect a big rise for BNB.
Good luck
NEoWave Chart
Binance coin has dropped from $800 ┆ HolderStatBINANCE:BNBUSDT surged from $532 support and is now battling $550 resistance. A daily close above $550 opens upside targets near $567. Rejection may drag price back into the $532–$537 range. Bias remains bullish while inside the current trend channel.

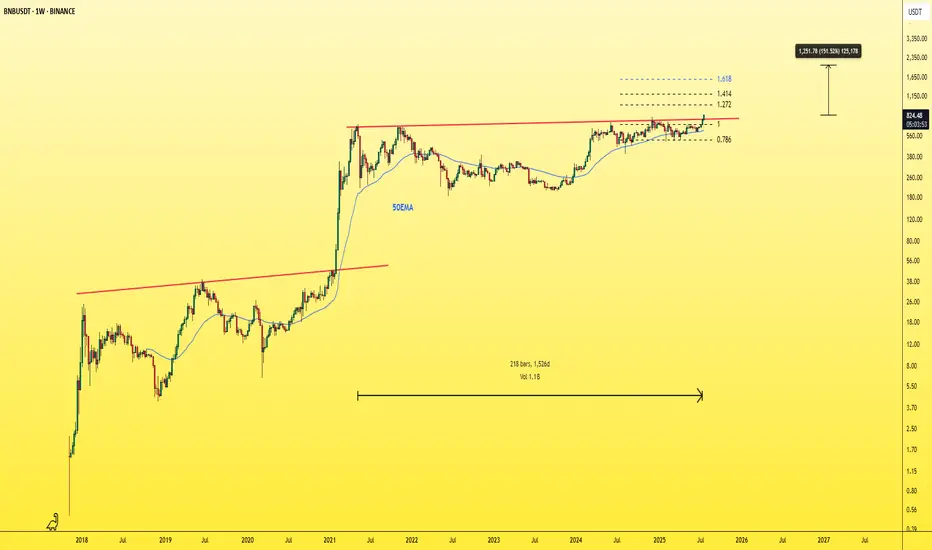
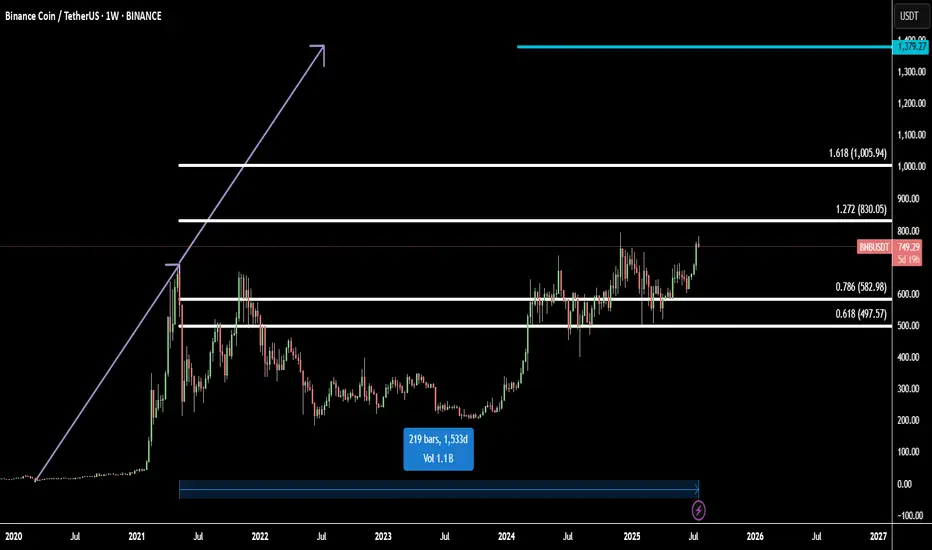
BNB Ready for All-Time High: Fibonacci + 1533-Day FlagBinance Coin (BNBUSD) is setting up for a major breakout, approaching its all-time high with strong momentum.
Technically, BNB has completed a 1533-day flag accumulation — a rare, long-term fractal consolidation that often precedes explosive moves. This massive base acts as a launchpad for the next bullish leg.
Using Fibonacci extensions, we identify two major upside targets:
Target 1: 1.272 Fib – 830.05 - the first resistance and profit zone
Target 2: 1.618 Fib – 1005.94 - key bullish extension from breakout range
Final Target: 1379.27
The final target is projected using fractal symmetry from previous bullish expansions, aligning with the broader market cycle and BNB’s historical price action.
This setup suggests a high-probability move toward new all-time highs and beyond, supported by strong technical structure and breakout energy.
Binance Coin (BNB): Bearish CME + Possible Buying OpportunityBuyers are still showing resistance on BNB while sellers are slowly leading the price down; what we see is another buy-side movement happening very soon.
What we are looking for is either a touch to that bearish CME gap, which would fill the gap, or just an immediate movement from the current zone.
One way or another we are looking for that break of structure where our major buy zone would be sitting. If we fill that CME, then there might also be a good buying opportunity if we form MSB.
Swallow Academy

$BNB Is ready for $1k USDLow 700s before continuation?
This one’s been coiling up beautifully — still waiting on that strong move to hit.
OKX:CATUSDT and BINANCE:CAKEUSDT are part of the rotation I’m betting on.
BINANCE:BNBUSDT has one of the strongest consolidation structures among high caps — and it’s also one of the biggest laggards.
Looks like a setup worth the risk.

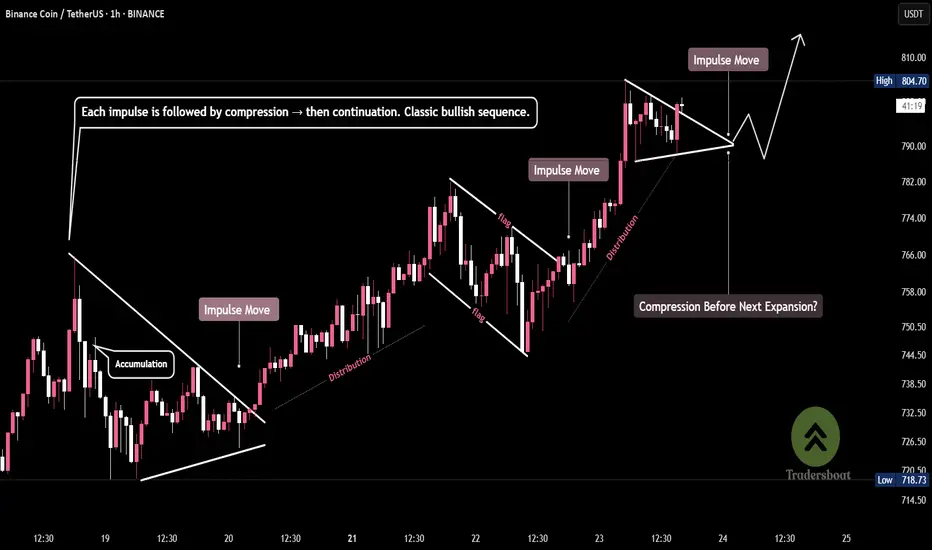
BNB/USDT - Price Action in HarmonyEvery move tells a story: impulse, compression, expansion.
Price respects structure and rewards patience.
Smart money accumulates in flags, then drives the breakout.
Another triangle forming... will history repeat?
BNB/USDT – Price Action in Harmony
Why BNB Remains Bullish and Its Next Potential Move !Currently,is forming an ascending triangle, indicating a potential price increase. It is anticipated that the price could rise, aligning with the projected price movement (AB=CD).
However, it is crucial to wait for the triangle to break before taking any action.
Stay Awesome , CobraVanguard.

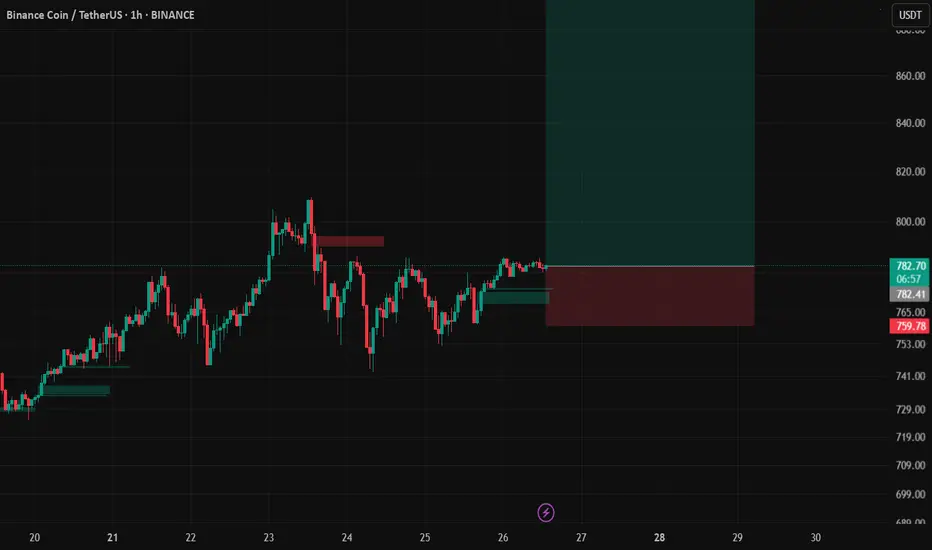
Bnb scalp short to $825 areaAnticipating a correction bnb soon. THe trend is still bullish but chancing a short as its quite high structurally. And saw signs of whales selling
Sl: $852.19 or higher
Tp: $825 area

BNB scalp long to $810 new ATHBNB been making new ATH and no one is talking about it. Looking to scalp it back up to a new ATH right now.
ITs already but looks likely to retest another time before it dumps
Sl: $791.46
Exi: $810
It just spiked up a bit so one would have to wait for a bit of pullback again to get good RR else skip.

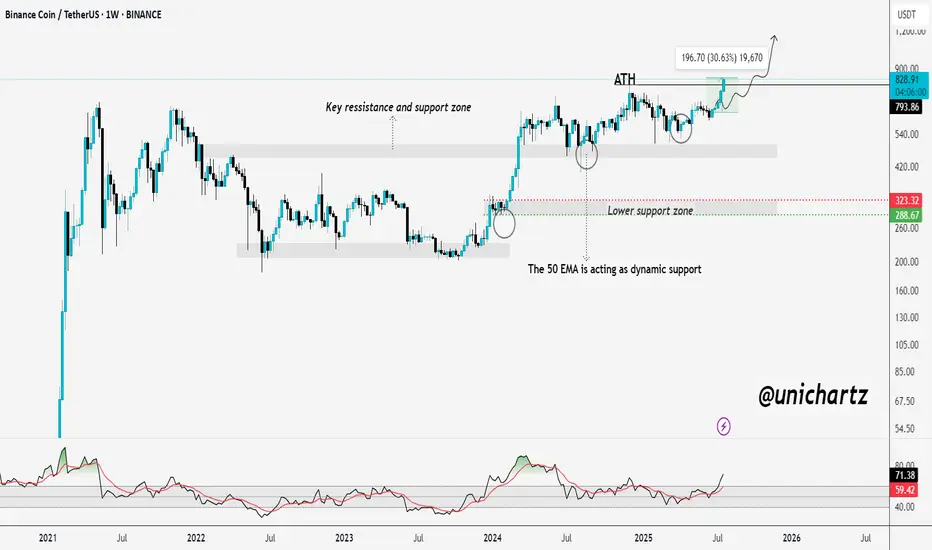
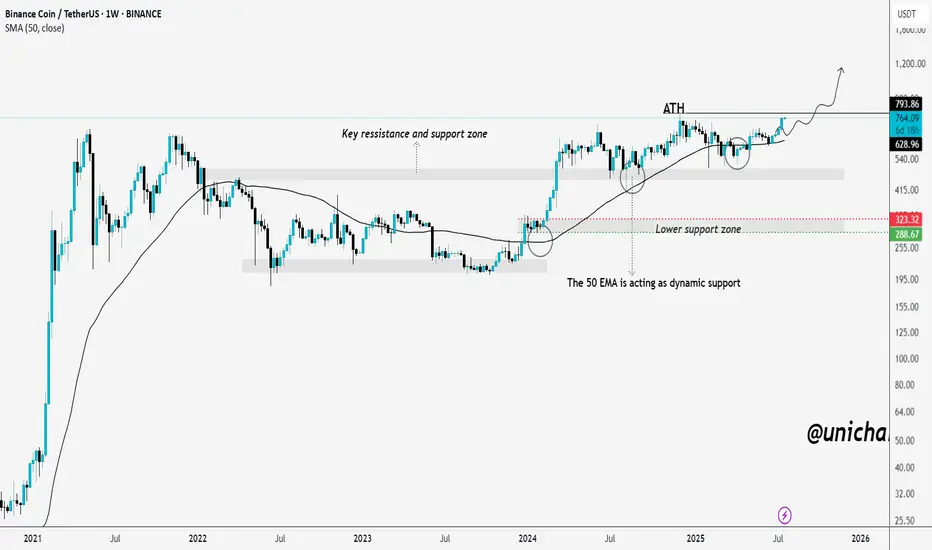
BNB on the Brink of a Breakout – ATH in Sight!We told you earlier — mark our words. BNB is now on the verge of breaking into a new all-time high, and the chart has been signaling this move for months.
The price has consistently respected the key support-resistance zone around $500–$540, and the 50-week EMA has acted as dynamic support throughout the uptrend.
Each dip into the lower support zone between $290–$320 was quickly bought up, showing strong buyer interest and demand. After several healthy consolidations and retests, BNB is once again approaching the previous ATH around $793.
If it breaks above with strong volume, we could enter price discovery mode. All the signs are aligning — and if you caught the early setups, you’re already in a great position. If not, it’s time to stay sharp and watch this breakout zone closely.
The momentum is real, and the fireworks might just be getting started.
THANKS
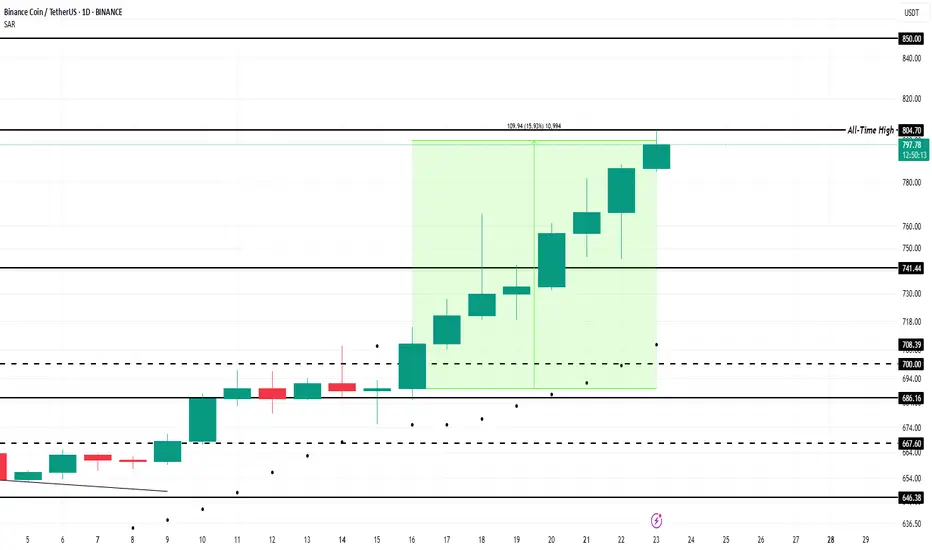
BNB Price Forms New All-Time High Above $800; Ends 7-Month WaitBINANCE:BNBUSDT price reached $804 today after a 16% increase over the past week, marking a new ATH . The altcoin has successfully ended a long period of consolidation and now stands at $799.
Its recent price movements indicate strong upward momentum, suggesting the potential for further gains. For nearly seven weeks, BINANCE:BNBUSDT has seen consistent accumulation . This trend is reflected in the exchange net position change, which shows growing investor interest in the altcoin
The bullish market sentiment is helping BINANCE:BNBUSDT break through key resistance levels. If this momentum continues, BNB could reach the $850 mark , a psychological milestone for the altcoin. This level could attract more investors and provide further price support, pushing BNB higher in the coming days.
However, should BNB holders decide to secure profits , the altcoin could face a price pullback. If selling pressure intensifies, BINANCE:BNBUSDT may slip below its current support level of $741 , which would invalidate the bullish outlook. A drop to this level would suggest a shift in sentiment, likely leading to a market correction.