BNB - Signal exploded hhh. PERFECTSignal and TA was given days ago.
We were watching for a breakout.
Boom. Almost 12 % 👌 🎯
You could take Monthly to Monthly level too.
TA/Signal given here:
Follow for more ideas/Signals. 💲
Look at my other ideas 😉
Just donate some of your profit to Animal rights and rescue or other charity :)✌️
BNBUSDT trade ideas

BNBUSDT BUY SETUPFor the crypto Ladies and Gentle men's, We have this buying Opportunity on $BINANCE:BNBUSDT.P. Pls watch the content of the post for better understanding.

BNB/USDT UPDAEHello friends
With the price drop, we now see that the sellers are gradually failing and the buyers have succeeded in supporting the price.
Now we can buy in stages and with capital management and move towards the specified goals.
*Trade safely with us*
Technically, the sell is not over for BNBTechnically, the sell is not over for BNB
$600 is currently acting as a resistance zone. If this force continues resisting the movement towards the north, we might see a drop southward again.
In this instance, $500 will again be the main psychological support level.
The trendline on my chart will be a great point for me to start applying my DCA strategy for another round of longterm holding.
Nothing is 100% sure. But I am convinced that the market has not been corrected fully.
Trade with care

BNB/USDT: BREAKOUT SETUP!!🚀 Hey Traders! Ready to Ride the BNB Breakout? 👋
If you’re hyped for this setup, smash that 👍 and hit Follow for elite trade ideas that actually deliver! 💹🔥
🔥 BNB Breakout Alert – Big Move Incoming! 🔥
BNB is looking strong and bullish, breaking out from a bull flag formation on the 4H timeframe. If it holds above the flag, we could see a massive 40% surge! 📈
💰 Trade Setup:
📍 Entry Range: $588 - $600
🎯 Targets: $628 / $688 / $746 / $794 / $844
🛑 Stop-Loss: $566
⚡ Leverage: Low (Max 5x)
🔎 Strategy: Enter with low leverage now, add more on dips, and ride the momentum to higher levels!
💬 What’s Your Take?
Are you bullish on BNB’s breakout potential? Share your analysis, predictions, or strategies in the comments! Let’s secure those gains and ride this wave together! 💰🚀🔥

BNBUSD Potential UpsidesHey Traders, in today's trading session we are monitoring BNBUSD for a buying opportunity around 590 zone, BNB is trading in an uptrend and currently is in a correction phase in which it is approaching the trend at 590 support and resistance area.
Trade safe, Joe.

BNB: 380 Days of Accumulation – Big Move Ahead?For over a year, BNB has been in a steady accumulation phase, holding strong while most alts dropped 80-90%. Its resilience in bear markets signals strength and stability, making it a solid contender for the next bull run. A breakout from this range could bring significant upside.
Entry: NOW
TP: 2000

Is BNB Soaring? The Future of a Crypto Star.🚀 BNB Soars Past Stubborn Resistance Levels: What’s Next for This Crypto Star? 🌟
The BNB token is making waves in the crypto market, delivering an awe-inspiring performance that’s leaving other coins in the dust! 💥 In a single day, this dynamic cryptocurrency smashed through two critical resistance levels: 603∗∗and∗∗
603--and--612.1—zones that many traders considered "stubborn" and hard to crack. 📈💪
🔥 Defying Expectations in a Volatile Market
In a market full of surprises, BNB’s bullish momentum has stunned even seasoned analysts. Breaking through tough resistance levels is no small feat, but BNB did it with style! 🎯 This rally highlights the token’s growing strength and investor confidence, especially amid the unpredictable twists of crypto trading. 🌪️
📉 Short-Term Pullback? Here’s What to Watch
While the surge is thrilling, a natural pullback from the 618∗∗levelseemslikely.🛑Historically,aftersuchexplosivemoves,marketsoftenretestprevioussupportzones.Tradersshouldkeepaneyeon∗∗
618∗∗levelseemslikely.🛑Historically,aftersuchexplosivemoves,marketsoftenretestprevioussupportzones.Tradersshouldkeepaneyeon--612.1 or even $602 as potential areas for a temporary dip. But don’t panic! 📉 This could be a healthy correction before BNB gears up for its next climb. 🧗♂️
💡 Golden Advice: Invest Wisely, Friend!
Crypto markets are thrilling but treacherous. 🎢 As BNB dances between highs and corrections, remember: “Invest smartly, my friend!” 🧠💼 Always diversify, set stop-losses, and never risk more than you can afford to lose. 🛡️
🚀 The Road Ahead: New All-Time Highs?
If BNB holds above key support levels, the door could open for fresh price discoveries! 🌄 Optimism is brewing, but stay vigilant—volatility is the name of the game. 🎮 Whether you’re a hodler or a swing trader, keep your charts close and your strategy tighter. 📊✨
🌍 Final Thought: BNB’s rally proves that in crypto, surprises are the only guarantee. Buckle up, stay sharp, and enjoy the ride! 🚨💎
#BNB #Crypto #ToTheMoon 🌙

$BNB Price Travel $888 Price Level Area and see more chart CRYPTOCAP:BNB OVERVIEW
ENTRY AREA IS $613 AND STOPLOSS $500 BELOW, LAST TRAVEL $888 PRICE LEVEL IN 2025
Bubblemaps Launches Token Generation Event on BNB Chain, Sets Fundraising Goal of $800K
According to an announcement from Binance, the event, which is exclusively hosted on the BNB chain via PancakeSwap, will run from 8:00 AM UTC to 10:59 AM UTC.
The TGE offers investors the opportunity to acquire 40 million BMT tokens priced at $0.02 each as the project team tries to raise $800,000 in BNB to fund further developments. This event would distribute 4% of Bubblemaps’ total supply of 1 billion tokens in return to participants.s
The project team noted that each wallet’s contribution would determine its share, which is proportional to the total BNB deposited. There is a participation cap of 3 BNB per wallet to ensure fair distribution.
Binance’s Pascal Hardfork to Enhance BNB Chain – Key Features and Price Impact Table of Contents Announcements / Trading Analysis
Binance’s Pascal Hardfork to Enhance BNB Chain – Key Features and Price Impact BNB.
Binance’s Pascal Hardfork to Enhance BNB Chain – Key Features and Price Impact
What the Pascal Hardfork Brings to BNB Chain
BNB Price Action and Market Predictions
BNB Chain’s Future Upgrades
Conclusion
March 11, 2025 – Binance’s BNB Chain has scheduled the Pascal Hardfork for March 20, bringing significant upgrades, including Ethereum compatibility on the mainnet. This move aligns with BNB Chain’s broader 2025 roadmap to enhance scalability, transaction efficiency, and decentralized governance.
The Ethereum EIP-7702 implementation enables gasless transactions, batch approvals, and multi-signature support, making it easier for users to interact with decentralized applications (dApps) on BNB Chain. The upgrade also activates BEP-439, which improves transaction security through BLS12-381 curve verification.
What the Pascal Hardfork Brings to BNB Chain
BNB Chain developers have emphasized the importance of this upgrade for Ethereum Virtual Machine (EVM) compatibility, helping bridge the gap between Binance and Ethereum ecosystems. Key benefits include:
Enhanced User Experience – dApps can now pay gas fees on behalf of users.
Stronger Security – BLS12-381 verification ensures secure smart contract execution.
Faster Transactions – The Pascal Hardfork sets the stage for future updates that will reduce block time.
Community Governance – The “Vote to List” and “Vote to Delist” mechanisms allow BNB stakers to decide which tokens stay on the BNB Smart Chain.
The upgrade requires node operators, validators, and exchanges to update to v1.5.7, or risk desynchronization from the network.
BNB Price Action and Market Predictions
As of writing, BNB trades at $564.56, fluctuating within the $550–$575 range.
Analysts observe structural shifts, with key resistance and support levels shaping the next price movement:
Bearish scenario – If BNB fails to hold $550, it may decline further to $525 or even $500.
Bullish scenario – Holding above $550 could push BNB to $600, with a potential breakout to $650.
BNB’s previous high at $725 indicates strong resistance, and a rejection from $575 may confirm further downside. However, if momentum shifts, the upgrade could help BNB regain ground amid broader altcoin market movements.
A distinctive feature of this TGE is the immediate tradability of tokens post-subscription, eliminating traditional lock-up periods. Investors can trade BMT tokens immediately after the event on either Binance Wallet’s DEX or directly on PancakeSwap. This real-time liquidity is a bold play, designed to attract traders and investors eager for quick action.
#BTC☀ #BinanceAlphaAlert #BinanceSquareFamily #Write2Earn #SUBROOFFICIAL
Disclaimer: This article is for informational purposes only and does not constitute financial advice. Always conduct your own research before making any investment decisions.

bnb almost finishing an inverted bullish patterninverted bullish pattern about to break up it s neckline in high tf ... hope bnb break s it up then heading to higher levels

Is BNB going to pump soon ?Currently, BNB is forming an ascending triangle, indicating a potential price increase. It is anticipated that the price could rise, aligning with the projected price movement (AB=CD).
However, it is crucial to wait for the triangle to break before taking any action.
Give me some energy !!
✨We spend hours finding potential opportunities and writing useful ideas, we would be happy if you support us.
Best regards CobraVanguard.💚
_ _ _ _ __ _ _ _ _ _ _ _ _ _ _ _ _ _ _ _ _ _ _ _ _ _ _ _ _ _ _ _
✅Thank you, and for more ideas, hit ❤️Like❤️ and 🌟Follow🌟!
⚠️Things can change...
The markets are always changing and even with all these signals, the market changes tend to be strong and fast!!

As long as BNB stays above 549, the only direction will be 575BNB is the strongest candidate for the $ 650 journey again, both as a stock exchange coin and as a coin left to us from the old bull.

#BNB/USDT#BNB
The price is moving within a descending channel on the 1-hour frame, adhering well to it, and is heading for a strong breakout and retest.
We are seeing a bounce from the lower boundary of the descending channel, which is support at 517.
We have a downtrend on the RSI indicator that is about to be broken and retested, supporting the upward trend.
We are looking for stability above the 100 moving average.
Entry price: 558
First target: 573
Second target: 591
Third target: 614

BNB/USDT 1DHello everyone, let's look at the 1D BNB chart to USDT, in this situation we can see how the price moves in the local triangle in which we approach the moment we leave and try to take the direction of further movement.
However, let's start by defining goals for the near future the price must face:
T1 = $ 595
T2 = $ 649
Т3 = 690 $.
T4 = $ 738
Let's go to Stop-Loss now in case of further declines on the market:
SL1 = $ 562
SL2 = $ 527
SL3 = = $ 474
SL4 = 436 $
Looking at the MACD indicator, you can see the traffic in the downward trend, but here you can see an attempt to change the direction and after

The Power of Math AND Statistics in Daily Trading The Power of Math in Daily Trading 📈💰
Ever wonder how to predict market movements? 🤔 Well, math and statistics hold the key! 🗝️ In daily trading, their power is undeniable. 📊 Take BNB, for example. It follows a balanced model, aligning perfectly with fundamental and classical analysis. ⚖️ When it comes to numerical analysis, a hidden strength emerges. 🌟
Look at the chart! 👀 Notice how the price moves rhythmically, reacting precisely to Fibonacci levels? 😮 The numbers speak, my friend! 🗣️ Math translates, and statistics make the decisions. 🧠 At $572.6, there was strong support, with the first resistance at $577. 🛡️
I wanted to share this fascinating chart moment with you all! ✨ #Trading #Math #Statistics #BNB #Fibonacci 🚀

BNB NEXT 12 H LET US SEEEEEEEECurrently, the BNB daily chart is presenting a positive buying trend, despite temporary bearish signals from Bitcoin. This scenario highlights the importance of focusing on key resistance levels. Specifically, the $578.4 resistance level is crucial. If BNB successfully breaks through this barrier and begins trading above it, this would be a strong and positive indicator for sustained upward momentum.
However, if BNB fails to breach the $578.4 resistance, we can anticipate a minor correction. This correction would provide an opportunity to reassess market conditions and potentially identify new entry points.
Let's observe how the market unfolds in the coming days! 📈
Stay informed with ongoing updates! 💡

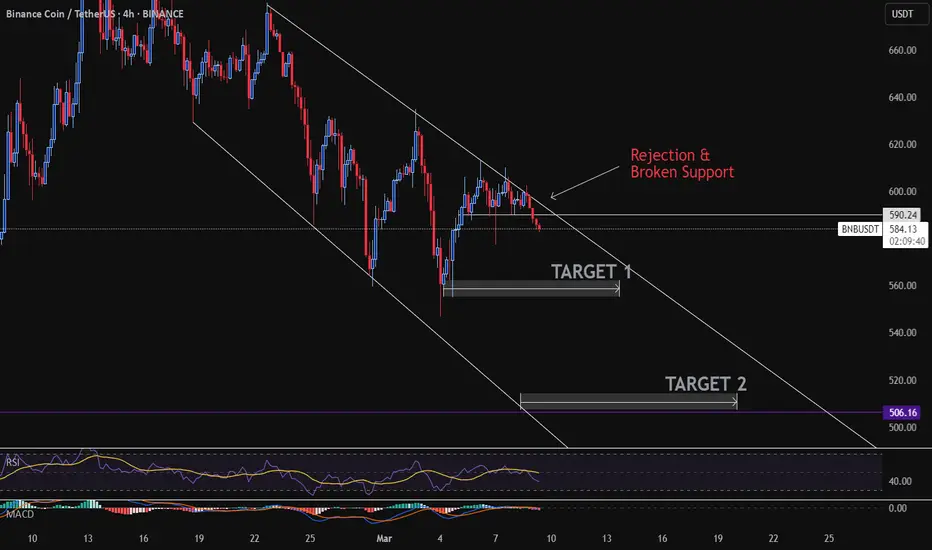
#BNB CONTINUES WITH THE FALLING WEDGE PATTERN BNB reached all our targets and is now continuing with the falling wedge pattern. If its rejected from this current area, we can expect more downtrend for now and possibly even complete a correction to the critical support zone (upward trendline).
A breakout to the upside is also possible and would see BNB reach $635 in the short-term.
Market is very unstable at the moment and fundamental news can trigger a change of trend any moment so trade carefully and always place a stop-loss!

Lingrid | BNBUSDT capitalizing on the PULLBACK OpportunityThe price perfectly fulfilled my previous idea. It hit the target. BINANCE:BNBUSDT market is continuing to create lower lows and lower closes showing bearish dominance. It recently broke below the 600 level and has retested the area above the psychological level of 500. Currently, the price is forming an ABC pullback toward the trendline, with the next key resistance zone around the 600 level. I think the price might rebound from this level and continue to push lower, unless the market formes an impulse leg toward the resistance zone. My goal is support zone around 546.
Traders, If you liked this educational post🎓, give it a boost 🚀 and drop a comment 📣

Why I Chose BNB for Trading and Investment?🚀 Why I Chose BNB for Trading and Investment? 🌟
BNB (the native token of Binance) is one of the most attractive cryptocurrencies for both traders and investors. Here’s why it’s a perfect choice for smart speculation:
1. Balanced Price Movements ⚖️
BNB is known for relatively stable price movements compared to other cryptocurrencies, without sudden violent fluctuations. This relative stability makes it a safer choice for beginners and professionals seeking less stressful trading 🧘♂️.
2. Ideal for Leveraged Trading 💸
Thanks to moderate volatility in the short term (1 to 12 hours), BNB is suitable for trading with high leverage. Price movements are not excessively erratic, reducing the risk of rapid liquidation 🚨.
3. Safety in Risky Trades 🔄
Even if you enter a trade and the price moves against your prediction, it often returns to the entry zone within two days due to balanced supply and demand. This flexibility minimizes losses and offers a chance to exit safely 🛡️.
4. Backed by Binance, the Giant Platform 🌍
BNB is supported by the world’s largest cryptocurrency exchange (Binance), ensuring high liquidity and long-term stability confidence 🔒.
5. Reasonable Liquidity Without Extreme Speculation 💧
Unlike some coins that face intense speculation in the spot market, BNB maintains balanced liquidity, making its price movements more realistic and analyzable 🕵️♂️.
6. Price Path Synced with BTC (But Less Volatile) 📊
BNB’s price trajectory aligns with Bitcoin by up to 90%, but with smoother movements. This feature allows traders to capitalize on broader market trends while reducing risks of sharp volatility ⚖️.
7. Easy to Predict Price Trends 🎯
Due to its strong correlation with Bitcoin’s movements and clear chart patterns, BNB’s price action can be predicted with high accuracy through simple technical analysis or monitoring BTC’s indicators 📉📈.
Conclusion: Why BNB? 🌐
BNB combines unique advantages: relative stability, backing by a giant platform, realistic liquidity, and easy analysis. All this makes it the ultimate choice for short-term traders and investors seeking a safer ground in the volatile crypto world!
🔥 Invest wisely, choose BNB for balanced profits! 🔥
#BNB #CryptoTrading #SafeInvestment 🚨💹

BNB Price action Analysis (6 AM to 6 PM UTC+3)Yesterday, BNB displayed a bullish trend 📈 during the specified timeframe, with a minor correction ⬇️ midway, offering traders a chance to enter the market at attractive prices.
Key Highlights of the Day:
Overall Trend: Bullish, testing a strong support level at 546.7 💪, which helped resume the upward momentum.
Near-Term Targets: The price is currently aiming for the 567 - 570 zone 🎯, with potential to break higher if bullish momentum continues.
Fibonacci Range: Spanning 518.7 (support) to 580.2 (resistance) 📊, reflecting potential price movement boundaries in the medium term.
The Critical Role of 546.7 🔑
The price rebounded strongly from this level after the correction, confirming its strength as a key technical support zone. This bounce injected confidence among buyers to push the price upward 🚀.
Upcoming Expectations 🔮
If the price holds above 567, we may see a test of the nearby 580.2 Fibonacci resistance.
Traders should monitor trading volume 📉📈 closely, as a sudden drop could signal a deeper correction toward 518.7.
Summary 🌟
The dominant scenario remains bullish, though cautious due to potential volatility. Placing stop-loss orders near 546 or lower could be a smart strategy ⚡.
Stay updated to catch new opportunities! 💼✨
#BNB #TechnicalAnalysis #SmartTrading 🚨

BNB Price Analysis: Key Levels to Watch in the Next 12 HoursBinance Coin (BNB) has shown significant activity in recent trading sessions, and the next 12 hours are expected to bring further price movements. Based on current market trends and technical indicators, here’s what traders and investors can anticipate:
Price Movement Expectations:
BNB is expected to experience some volatility over the next 12 hours. While a test of the support level is possible, the primary focus is on upward momentum. BNB is likely to test higher resistance levels.
Key Levels to Watch:
Resistance Level ($570.1): The main target for BNB in the short term is the resistance level at $570.1. This level, marked in black on the charts, represents a significant barrier. If BNB manages to break through this level, it could signal further bullish momentum.
Support Levels: Although a retest of support is less likely, traders should monitor potential support zones in case of a sudden pullback. These levels will act as a safety net for the price.
Market Sentiment:
Overall sentiment for BNB remains cautiously optimistic. The coin has been consolidating recently, and the next 12 hours could determine whether it continues its upward trajectory or faces a temporary correction. The levels marked in black on the chart are crucial, as they highlight areas where price action is expected to intensify.
Conclusion:
In summary, BNB is poised to test the $570.1 resistance level within the next 12 hours. While a test of support is not entirely ruled out, the focus remains on the upside potential. Traders should closely monitor the levels marked in black, as they will play a critical role in determining BNB’s short-term price direction.

400 to 500 Zone – A Whale’s Playground
BINANCE:BNBUSDT CRYPTO:BNBUSD continues to follow a structure of higher highs and higher lows, signaling that the broader trend remains intact despite the recent pullback. Price is approaching the key support zone between 500 and 400, a range that coincides with psychological round numbers, an area where large market participants may step in to accumulate.
A strategic approach would be placing buy orders below 500 while implementing a Dollar Cost Averaging strategy down to 400 to smooth out entries in case of further downside. If the price confirms a reversal from this zone, the next targets align with 650 and ultimately 790, where prior resistance has been established.
The weekly EMA Ribbon remains bullish, providing dynamic support, which strengthens the probability of a continuation to the upside once this correction plays out.
Now the key question is whether buyers will defend this critical zone or if sellers will push for a deeper retracement.
👨🏻💻💭 What is your take, are you positioning for accumulation or waiting for further confirmation?
__
The information and publications within the 3Commas TradingView account are not meant to be and do not constitute financial, investment, trading, or other types of advice or recommendations supplied or endorsed by 3Commas and any of the parties acting on behalf of 3Commas, including its employees, contractors, ambassadors, etc.

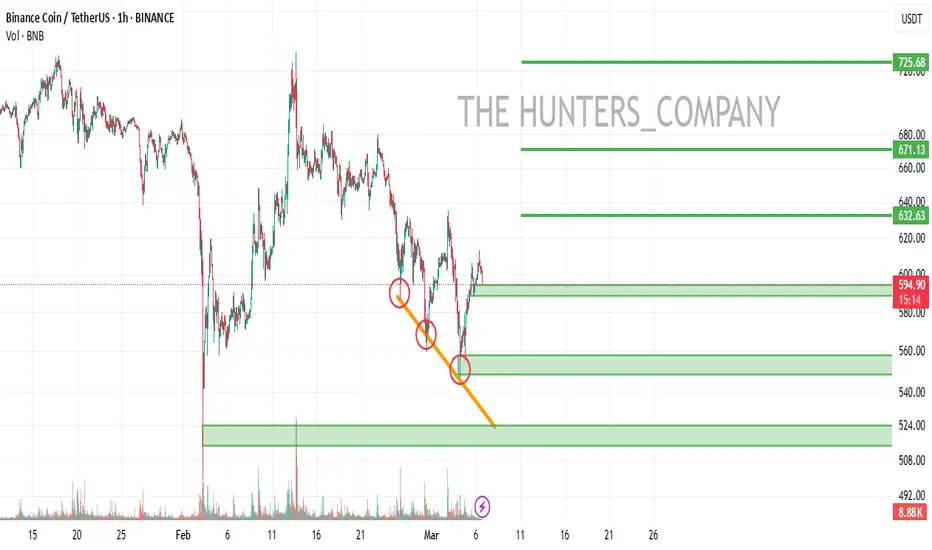
#BNB UPDATEBNB failed to close the break of the falling wedge and rejected at the zone, as well as breaking the support on the 1h chart meaning BNB will continue down for now, with the falling wedge pattern.
The next support zone is at $560 which is my 1st target, the area at $510 is my 2nd target, although we may see a little bounce off the 1st area first!