BNB SWING LONG IDEA - ALTCOIN SEASON - BNB CHAINBNB is one of the most stable coins in the crypto market. With Binance officially backing it, BNB is relatively safer compared to other altcoins.
Technical Analysis: The price hit and wicked into the monthly demand zone during the August 5th dump, showing a strong rejection and initiating an upward trend. This move established a weekly demand zone by breaking the weekly structure, and as it did so, it created a daily demand zone, which is a significant area for me.
Currently, the price is back into the daily demand and has reached the optimal trade entry zone according to the Fibonacci levels. I anticipate an upward movement from here in the coming days.
Targets: The initial target is $613-$619, with potential to reach the all-time high at $722.
Note: Watch out for the U.S. Presidential Election, as it may cause volatility with long wicks that could stop out positions.
BNBUSDT trade ideas

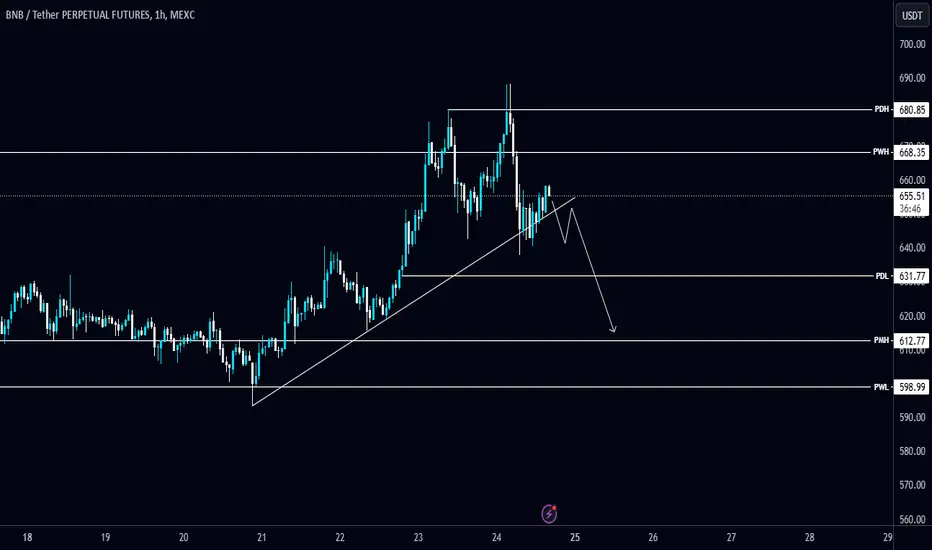
Keeping an eye on #BNB/USDT Diagonal Trendline in 1-Hour TF!Keeping an eye on #BNB/USDT Diagonal Trendline in 1-Hour TF!
Wait for trendline breakdown/retest to short the $BNB. The local resistance level is PWH $668.35 and the support level is PMH $612.77.
The last bullish chance of BNB in mid-term !!The BNB is in a ascending triangle now which means the price will increase and also It is expected that the price would at least grow as good as the measured price movement(AB=CD)
Note: we should wait for the breaking of the triangle and than make a move!
See my first analysis on BNB in 2020
Give me some energy !!
✨We spend hours finding potential opportunities and writing useful ideas, we would be happy if you support us.
Best regards CobraVanguard.💚
_ _ _ _ __ _ _ _ _ _ _ _ _ _ _ _ _ _ _ _ _ _ _ _ _ _ _ _ _ _ _ _
✅Thank you, and for more ideas, hit ❤️Like❤️ and 🌟Follow🌟!
⚠️Things can change...
The markets are always changing and even with all these signals, the market changes tend to be strong and fast!!

BNB on the Brink of a Major BreakoutBinance Coin (BNB/USDT) is approaching a key resistance zone in Blue at $605.5 to $618.5. It's tested this level multiple times, suggesting a possible breakout if it closes above. The target? Around $721.8, 16.54% . A rejection could lead to retesting lower support. Stay tuned

Buy BNNBNB is breaking out again. After a many cryptos doing well, finally it starts moving and now is the time to move.
Fundamentally this is the only crypto with serious functionality and utility.
The charts has build up a solid support and setup.
Support: former levels, build up of momentum indicators.
Setup: break out is only a few dollars away, imacd is showing green.
Buy now for 40+ % rally (based on current pattern).
Enjoy!

BNB 1000$The bull market has just started
You must buy good and strong currency
One of the currencies that definitely has room for growth is Binance Coin
which will most likely see above 1000 dollars soon


#BNBUSDT By looking at the chart as a whole,
we can guess what will happen next if
the strong red resistance band and the final ceiling are broken.
watch it carefully

BNB to $1500BNB looking primed to break out. Volume is increasing and we are holding above the 100 day VWMA.
Targeting $1500 to complete macro 5th wave.
Would like to see BNB hold $520 and volume increase as we break higher.

Trading opportunity for BNBUSDTBased on technical factors there is a Buy position in :
📊 BNBUSDT
🔵 Buy Now
🪫Stop loss 592.00
🔋Target 1 660.00
🔋Target 2 715.00
🔋Target 3 800.00
💸RISK : 1%
We hope it is profitable for you ❤️
Please support our activity with your likes👍 and comments📝

#BNB Ascending Triangle📊#BNB Ascending Triangle📈
🧠From a structural perspective, the ideal goal of the bullish structure has not been fully achieved, so we still maintain our bullish view. Currently, it has encountered a staged resistance area and has undergone a complex horizontal consolidation.
➡️From a graphical perspective, we have the opportunity to form an ascending triangle between the neckline support area and the staged resistance area. Generally, we will continue to rise according to this model in an upward trend
➡️Can we challenge the historical high this time?
Let's see👀
🤜If you like my analysis, please like💖 and share💬
💕 Follow me so you don't miss out on any signals and analyze 💯 BITGET:BNBUSDT.P

#BNB 1H. Good resistance zoneAt the moment, the asset is in accumulation (sideways movement), where the price reacts to the support level each time. I expect a similar movement this time as well.
Locally, #BNB looks set to continue its growth, just like other altcoins, so personally, I continue to work from the buy side. I’ve illustrated the setup on the chart.

Cihan automatic linear regression lines 2024 V1Cihan automatic linear regression lines 2024 V1
Fully automated and it helps a lot to identify the trend of the chart very easy.
Enjoy and like.

BNBUSDT.1DAs I analyze the BNB/USDT daily chart, Binance Coin is currently trading at 624.17. The chart displays a well-defined upward channel, with the price respecting the ascending trendlines. This suggests that the overall trend remains bullish in the medium term. The immediate resistance is located at R1 (around 619.29), which BNB has just surpassed, while the next major resistance lies at R2 (721.54), near the channel’s upper boundary.
On the support side, the price has strong levels at S1 (around 575), S2 (527.41), and S3, which aligns with the lower boundary of the channel. These levels provide significant zones of interest where the price could find buying pressure in case of a correction.
The MACD (12, 26) indicator shows a bullish crossover, with the MACD line above the signal line. The histogram is also positive, although it appears to be stabilizing, signaling that bullish momentum is strong but could be losing a bit of its intensity. This calls for close monitoring to see if the current momentum can be sustained.
A breakout above R2 (721.54) could confirm further bullish continuation, with the price potentially targeting levels beyond 750 or higher in the coming weeks. On the other hand, a rejection at R2 or a loss of momentum might result in a pullback toward S1 or S2, where the price could consolidate before making another attempt to move higher.
In conclusion, I remain optimistic about the upward potential of BNB/USDT, particularly if it continues to trade within the rising channel. My primary focus is on the behavior of the price around R2 and the strength of the current momentum. A breakout above R2 would affirm a strong bullish trend, while any pullback toward S1 or S2 could provide opportunities for accumulation before the next upward leg.

BNB Surges by 131% to $721 – A Prediction Fulfilled!The cryptocurrency BNB has delivered an extraordinary rally, soaring by 131% to reach an impressive price of $721. This massive rise is a testament to the strength of the market and the accuracy of our analysis. In our **last signal published on May 30, 2023, we forecasted this bullish move when BNB was trading at just $312.
The anticipated growth materialized perfectly, aligning with our detailed analysis and market projections. This achievement underscores the importance of strategic insights and the ability to identify potential opportunities in the cryptocurrency space. As BNB continues to gain momentum, we remain confident in its long-term potential. For those who followed our signal, this is a moment of triumph, validating the power of precise predictions.

BNB short ideaIt's forming a bearing flag which is a continuation of a downtrend, potentially, but nothing is for sure in trading!

The cartel gridBinance cartel has been holding BNB in this ridiculous range for quite some time now. Because they saw the bull run coming. Now they have little time to cancel this grid.
Dear cartel of Binance, you have time until December. You cancel the grid or I'm starting to sell all of my BNB.


2 RR tradeNow that BTC is ranging, there is a relatively strong range on the bottom to take here for the anticipated rebound.

Lingrid | BNBUSDT bullish MOMENTUM. Long from SUPPORT zoneBINANCE:BNBUSDT is currently in a bullish trend. Recently, it broke and closed above the consolidation zone, successfully breaking the 610 level, which had been tested multiple times. This contraction has led to expansion, suggesting that the market is likely to continue moving upward toward the resistance zone around 1000 setting up new all time highs. There is a possibility that the market may form a pullback toward the support zone before the further bullish direction. This pullback could provide a good buying opportunity for those looking to enter before the anticipated upward movement resumes. My goal is resistance zone around 700
Traders, if you liked this idea or if you have your own opinion about it, write in the comments. I will be glad 👩💻

BNB/USDT Chart Update !!BNB/USDT 1-day chart shows a bullish setup, showing the price breaking out of a descending triangle pattern, which is typically a continuation signal. Here is a breakdown of the analysis:
BNB has recently broken the descending trendline of the triangle, indicating a bullish trend continuation. As indicated by the green line, the next target appears to be around the $713 resistance level.
The 50-day (red) and 200-day (green) moving averages are both located below the current price, providing strong support levels if a pullback occurs. This setup is favorable for the continuation of the bullish momentum.
The downward-facing upward trendline indicates additional support, which could protect the price from significant declines and maintain the bullish structure.
This setup is favorable for a long position, with a target around $713 and a stop-loss below the breakout level to manage risk effectively. Keep an eye on potential pullbacks to the trendline or moving averages for re-entry points if the bullish momentum stalls.
Disclaimer: This analysis is for informational purposes and is not financial advice. Always stay updated with market movements and adjust your trading strategies as needed.
You can DM us for information on any other coin.
@Peter_CSAdmin

BNBUSDT ready to BREAKOUTThe market has been in consolidation phase.
Overall the market is puhsing higher.
The current consolidation is a just a bus stop before breakout.

$BNB Now $640 and Road to $1K If Price Breaks $800 see on chart BINANCE:BNBUSD
CRYPTOCAP:BNB Now $640 and Road to MIL:1K If Price Breaks $800 see on chart
🚦Follow Binance Square: app.binance.com
Disclaimer: Digital asset prices are subject to high market risk and price volatility. The value of your investment may go down or up, and you may not get back the amount invested. You are solely responsible for your investment decisions and Binance is not liable for any losses you may incur. Past performance is not a reliable predictor of future performance. You should only invest in products you are familiar with and where you understand the risks. You should carefully consider your investment experience, financial situation, investment objectives and risk tolerance and consult an independent financial adviser prior to making any investment.
