BNB/USDT Trading Scenario UpdateAt the beginning of 2024, after a short-term accumulation phase, BNB showed a significant increase, reaching a local maximum of $723.5. This growth amounted to more than 140% from previous levels. Currently, the asset is in a prolonged accumulation phase, which has been ongoing since March until the present day.
From a volume profile perspective, the current price zone represents significant interest for market participants. It is also important to note the shift of significant volumes and the Point of Control from the $315 level to $584.
The shift of the POC to a higher level ($584) indicates that market participants are showing interest in buying at higher prices, which in turn could serve as a prerequisite for sustainable price growth in the future.
A breakout of the local maximum level at $723.5, followed by consolidation above, could open up the potential for further growth of BNB. If this resistance level is successfully overcome, the asset may enter a bullish trend phase with new price targets.
BNBUSDT trade ideas

BNBUSDT.1DExamining the daily chart of BNB/USDT, the price trajectory of Binance Coin shows a dynamic response to market forces characterized by bullish and bearish phases. The recent formation depicts a rising wedge, typically a bearish pattern, suggesting potential for a downward correction if the support levels fail to hold.
Currently, BNB is trading at $576.8. The chart indicates a crucial resistance at $620 (R1), and a more significant barrier at $722 (R2). On the downside, the immediate support is at $466.9 (S1), with further substantial support placed at $400.1 (S3). The resistance and support levels are clearly identified on the chart with precise figures which help in determining strategic entry and exit points in trading scenarios.
The Stochastic RSI shows a value of 39.12, which lies in the neutral zone but leans towards being oversold. This could suggest a potential buying opportunity if other indicators align. Meanwhile, the MACD is below the signal line and trending negative, which can indicate bearish momentum, albeit this needs to be viewed in conjunction with other market factors and a possible slowing in negative momentum as indicated by the histogram's gradual ascent towards the zero line.
Considering these factors, if BNB/USDT can maintain above the S1 level and gather upward momentum, we could anticipate a retest of R1 at $620. However, a decisive break below S1 could see BNB heading towards the more profound support at S3 around $400.1, which would align with the pattern's typical resolution following a wedge.
For trading, it would be advisable to watch for a clear break in either direction with confirmed volume, and to consider external market influencers such as regulatory news or broader economic factors. Always utilize stop-loss orders to manage risks associated with sudden price movements inherent to cryptocurrency markets. This analytical approach ensures a calculated strategy, enhancing the potential for profitable trades while mitigating risks.

BNB Struggles to Break ResiBNB Struggles to Break Resistance
The price of BNB has been struggling to overcome a resistance block that has kept the altcoin subdued for the past seven months. The current resistance range is between $575 and $619, and although BNB has shown bullish signs recently, it's still uncertain whether the coin can break through this barrier.
A successful breakout could push BNB to a four-month high, but traders are closely monitoring to see if the momentum will hold.
BNB Holds Hope for a Rally
In recent days, Open Interest (OI) in BNB has dropped by over $100 million, indicating that traders are closing their positions. Interestingly, the funding rate remains positive, suggesting that short sellers are the ones pulling back.
This could be a bullish sign for BNB, as fewer short positions would mean less downward pressure on the price. A reduced number of shorts could give BNB the boost it needs to break through resistance.
While the drop in OI might initially seem bearish, the positive funding rate points to market optimism. If traders continue to unwind their short positions, BNB may finally surpass the $575 resistance level and continue its upward trajectory.

Breakout Potential and Targeting Next ResistanceI’m currently watching BNB as it approaches a small resistance level. If we break through this resistance, my first target would be the next key resistance zone. I’ll be waiting for a strong breakout confirmation before making any decisions.

Dual Strategy for BNB/USDT: Buy or Sell OpportunitiesBuy Strategy:
Entry: Look to enter a long position if the price holds above the 563 - 567 support zone, showing signs of a reversal.
Target: Aim for the 581 resistance level as your first profit target.
Stop Loss: Place a stop loss below the 563 level to protect against further downside.
Sell Strategy:
Entry: If the price fails to break above 581 and shows signs of weakness, consider entering a short position from this resistance level.
Target: The first target could be the 563 - 567 zone. If price breaks below this, the next target is around the stronger support zone between 540 - 550.
Stop Loss: Place a stop loss above 581 to minimize potential losses in case of a breakout.
By balancing these two approaches, you can capitalize on price movement whether it goes up or down. Good luck with your trades!

BNB Dump ! Soon ! Rocket bnb is powerfull crypto but needs to retest some levels and achive all liquadities around this price
YOu can also see my other anlysis here @TradeWithmky more than 91% winrate live in Trading view

BNB ScalpTake it one trade at a time, having long and medium term trades is fine, but sometimes you see the opportunity short term and you have to take it.
Good R/L.

BNBUSD_1Dhello
Binance Coin Time Daily and Long Term Analysis The market is preparing for an upward wave Currently, it can form the pattern of the top of the floor and only if the number 550 is maintained, it can complete the pattern and prepare for the target of 833.
⚠️The important number is 550

Binance 1KCZ is out, binance is the most profitable business in the crypto industry.
This is a no-brainer, BNB at 1k is a matter of when, not if. This trade works better without leverage because the time to reach 1k could be 3 months to 1 year imo.
GL

Binance coin ANALYSISGiven that it was able to drop to $400 very easily, which I marked as wave A, I see no problem or impossible excuse for it not to drop below $400.
Considering many other crypto analysis, this is a possible opportunity to break below $400.
Ew probability says minimally below the pink line(or green).
As long as it is below $700 there is no evidence that it is bullish
I could be wrong
MD

bulish bnb...you can see green line in chart and indicator RSI in time 4h is verey far but you can waeit for entry point....590/600


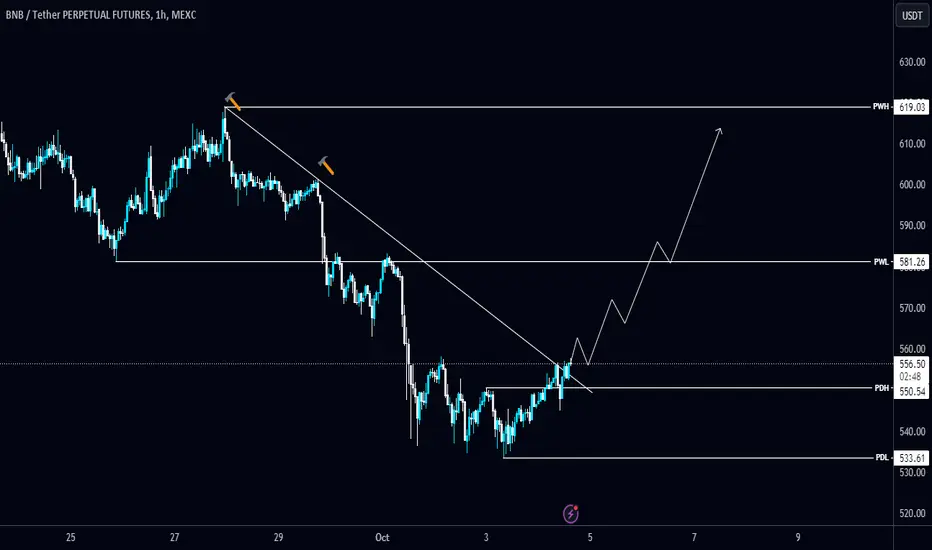
#BNB/USDT breaks and holding the Diagonal Trendline in 4-Hour TF#BNB/USDT breaks and holding the Diagonal Trendline in 4-Hour TF!
Waiting for a confirmation to open a long position. The local resistance level is $582.25 and the support level is PDH $550.55.
#BNBUSDT Showing Signs of Weakness | Is it Time to Sell #BNB? Yello, Paradisers! Are we about to witness a major #BNB breakdown or a move upward? Let's discuss the latest analysis of #BinanceCoin:
💎#BNBUSDT has been showing clear signs of weakening bullish sentiment, much like Bitcoin. Recently, we observed a failed breakout from a key resistance zone, further strengthening the bearish outlook. Now, as #BinanceCoin approaches this major resistance again, there’s a real possibility it could fail to break through once more.
💎The diminishing trading volume and the Point of Control (POC) from the VRVP indicator acting as resistance increase the chances of a further drop. If #BNB fails to break the crucial resistance zone between $610-$637, it’s highly likely we will see a retest of the Bullish Order Block (OB) at $471.6.
💎However, should #BNB fail to hold at $471.6, the next major support zone to watch is at $387. This area is rich in liquidity and could create a strong opportunity for a pullback if tested.
💎On the flip side, if the symmetrical triangle’s lower support holds up well, we could see the bulls regaining control, potentially sparking a bullish rally. Keep in mind that the overall market sentiment, along with Bitcoin’s price movements, will play a key role in determining #BNB’s next move.
If you want to be consistently profitable, you need to be extremely patient and always wait for high-probability trading opportunities.
MyCryptoParadise
iFeel the success🌴

BNB In a Confirmed Bearish ChannelBNB In a Confirmed Bearish Channel
From our previous analysis on BNB the price could reach more than 618.60 and resulted that it
was a very strong zone.
Today the price broke through 595 by confirming a possible bearish movement.
The current breakout looks solid and the pattern also looks really good.
This is rising the chances for a bigger bearish correction.
This new confirmation of the movement that we already had on the cards is showing the possibility that BNB may test 545 and 500 soon.
You may find more details in the chart!
Thank you and Good Luck!
❤️PS: Please support with a like or comment if you find this analysis useful for your trading day❤️

Binance Coin: Should I Buy Or Should I SellLet's say this pair breaks the chart pattern and goes up, how far up can it go? How certain and confident would you feel as it rises knowing that the pair started to rise from a resistance level rather than support?
How much money do you have?
How much money do you intend to make?
What are your goals?
What are you doing here?
Why are you trading?
If you are a mega-whale, you are not reading this, so you are not.
If you are a normal, average human being, let me speak to you.
Bitcoin, Binance Coin, Ethereum and the rest are giants and giants use them to play. The giants have millions, hundreds of millions and even billions, this is not the game for people like us. We have to go smaller because we are small. Accepting our position has to be on the list of qualities needed to achieve success.
When a giant pair like this grows 20%, a smaller Altcoin can grow 300%.
If you have 1,000$ USDT or say, a capital of 20,000$ USDT, we are better off doing some research, looking at the smaller pairs and playing where we can win.
There is a huge difference between a bottomed out and a topped out chart.
I don't care who you follow;
I don't care who you have been reading;
I do care about your goals.
If you are in this to win or to make money, get your mind straight. Wake up and stand up.
This is not the right move, this is not the right time to go LONG.
The right time was between June 2022 and December 2023, we are now in October 2024.
You can say the whole day, "But it can rise, it is going to rise!" But that is not my point.
My point is the risk. When prices are high, if you are buying with a bullish perspective, the risk is too high for a drop. Even if we get a 10%, 20% or even 50% rise, it can come crashing down the next day. 50 days rising and we get 15 days of gains removed in just 3 days. When we are 14 days in the down-wave, we will have all the gains removed for the last 50 days and some more, we might be even looking at new lows.
My point is that there are pairs trading at the bottom, smaller pairs, and these have less risk and a higher potential for reward.
Choose your trades wisely. Not everything will grow.
Some pairs are set to move down, while others are set to move up.
It is complex but it becomes easy if you take the time to read, plan and prepare.
I am rooting for your winning and success.
I am here sharing my experience so that you don't have to go through the same mistakes that I made.
I lost so many times in the past that I know when the time to buy is right, and when it is time to stay away.
It is not because I am making predictions, it is experience gained through loss and pain.
Let them drop.
I will post right here, in this same platform, on this same account, on this same pair, when the bottom low is in... Right now, the chart is looking bearish.
Namaste.

BNBUSDT 4 TFBNB Bounce Play
Bullish divergence
Strong Support
Breakout Retest
0.382 Bounce Play
MA 200 Bounce Play

$BNB's Holy Grail Confluence: High-Odds Long Setup! Overview:
Binance Coin CRYPTOCAP:BNB is presenting a high-probability long opportunity backed by multiple confluence factors, akin to the "holy grail" of trading setups. With Bitcoin (BTC) holding the $60,000 level and bouncing back, both BNB and BTC are exhibiting bullish divergence on the 1-hour chart. BNB is firmly supported at the $535-$545 range, hitting previous support levels and reinforced by a High Volume Node (HVN) just below it.
Additionally, both BTC and BNB have crossed above the Volume Weighted Average Price (VWAP) and the 30 & 60 Exponential Moving Averages (EMAs) on the 15-minute chart. The Relative Strength Index (RSI) is crossing above 50 on the 1-hour chart, signaling increasing bullish momentum.
As traders, we manage probabilities, and this setup—with multiple confluence points—is as close as it gets to the "holy grail." These factors collectively enhance the odds in favor of a successful long trade. 📈
Technical Analysis:
🔹 Strong Support at $535-$545:
Previous Support: BNB is holding above this critical support zone, which has acted as strong support in past trading sessions.
High Volume Node (HVN): Significant trading activity below adds extra support, suggesting heavy accumulation.
🔗 BTC Correlation:
BTC Holding $60k: Bitcoin maintaining the $60,000 level and bouncing back adds bullish momentum to the crypto market.
Bullish Divergence: Both BTC and BNB show bullish divergence on the 1-hour chart, a powerful indicator for potential upward movements.
📈 VWAP and EMA Crossovers:
Above VWAP and EMAs: On the 15-minute chart, BNB has crossed above the VWAP and the 30 & 60 EMAs, indicating a shift to bullish momentum.
💪 RSI Momentum:
RSI Crossing Above 50: The 1-hour RSI is crossing above 50, confirming increasing buying pressure and bullish sentiment.
Trade Setup:
🟢 Entry Point:
Consider entering a long position around the current price level ($549), after confirmation from the aforementioned indicators.
🛡 Stop Loss:
Place a stop loss at $532 to manage risk effectively.
🎯 Take Profit Targets:
TP1: $570 – aligns with minor resistance levels.
TP2: $580 – corresponds with the next overhead HVN, offering an attractive risk-to-reward ratio.
💰 Risk-to-Reward Ratio:
Approximately 1:1.5 or 1:2, depending on your stop loss placement and risk appetite.
Key Factors to Monitor:
🌐 BTC Movement: Continued bullishness in BTC can further support BNB's upward trajectory.
Conclusion:
BNB is showcasing a "holy grail" confluence with multiple high-odds factors aligning for a significant upward move. The strong support levels, bullish divergence, crossing above key moving averages, and positive RSI momentum collectively create a robust long setup. Managing probabilities through these confluence points enhances the confidence in this trade idea. 🧠✨

BNB - BEST Buy ZonesHistorically , large wicks usually get filled almost in the same way that a gap gets filled. It may not be soon, but if you're willing to wait a few weeks (or even a few months) you could get in lower and buy at a more ideal price.
(see Warren Buffet's trading philosophy on Buying at the RIGHT PRICE👇)
The particular wick in reference is the following one. The range is extremely wide, and there's a $100 gap where you could possibly dollar-cost-average:
Even if we would fall this low in the SHORT term, the price would still be bullish - we are evidently still trading in a bullish cycle, as this is likely a multi-month corrective pattern paying out. If you've been following for a while, you'll know i have been referring to this multi-month cycle on numerous occasions; anticipating the final impulse wave up according to Elliot Wave Theory (wave 4-5).
In the meanwhile, you could get lower entry prices on your favorite altcoins.
__________________________
BINANCE:BNBUSDT

BNB Short TradeBNB is signaling a potential correction, with targets around $400. The bearish momentum suggests further downside pressure, so watch key support levels closely for confirmation of this short trade. Stay cautious and manage your risk! 📉 #BNB #Crypto #ShortTrade"

Sell BNB $Short postion leverge 50x to Target 🚀🚀
in this chart price can touch green areas Easily for sure so you can enter short postions with some martingels !

BNB Locked in a Persistent Downtrend: Navigating the Bearish Ch.**BNB Locked in a Confirmed Bearish Channel: Deeper Correction Ahead?**
In our previous analysis of BNB, we identified the 618.60 level as a pivotal resistance zone, marking a significant turning point for the asset. This zone acted as a major barrier, and true to form, BNB was unable to sustain its upward momentum after testing this level. As a result, the market has shifted gears and is now signaling a deeper bearish correction.
Today’s price action saw BNB decisively break below the 595 level, reinforcing the confirmation of a bearish trend that has been gradually building. The strength of this breakout appears solid, with technical indicators aligning to suggest further downside potential. The pattern forming in the charts looks robust, further enhancing the probability of an extended bearish movement.
This shift in sentiment raises the likelihood of a more pronounced downward correction in the coming sessions. Based on the recent breakdown and the broader technical picture, BNB now faces the possibility of testing key support levels at 545 and 500. These zones may serve as critical areas where buyers could re-enter the market, but until then, the bearish outlook remains firmly in play.
The confirmation of this bearish movement, which was already anticipated in earlier analysis, adds weight to the idea that BNB's recent price action is part of a broader correction cycle. Traders should closely monitor how the asset behaves around the 545 and 500 levels, as these areas will be pivotal in determining whether the correction continues or if a potential rebound is on the horizon.
In conclusion, BNB's confirmed bearish channel signals a potential for further declines, with key supports looming ahead. While the overall technical setup suggests that the market may see increased selling pressure, the upcoming tests of the 545 and 500 zones will be crucial in shaping the next phase of BNB’s price action.
Traders, if you found this idea helpful or have your own insights to share, feel free to drop a comment. I’d love to hear your thoughts!

The Patience Game: Waiting for Binance to Drop to $335 demandLook at the significant monthly demand level for Binance’s BNB at $335. The chart below displays where this imbalance is situated. Will Binance decrease to that level? We cannot say for certain, but it is what we anticipate in the upcoming weeks. It is possible that Binance will not drop and instead continue to surpass its all-time high, but we are discussing probabilities here.
