BOME breakout WEAH HIGHT. Waiting for big pump on it
LONG #BOME-USDT
❌ Cross: x1 to x10
🛒 Entry point: below 0,0135
🎯 TP 1 (5%): 0,014175 (50%)
🎯 TP 2 (10%): 0,01485 (100%)
🎯 TP 3 (15%): 0,015525 (150%)
🎯 TP 4 (20%): 0,0162 (200%)
🎯 TP 5 (25%): 0,016875 (250%)
🛑 Stop loss: 0,012825 Very Important! In case it drop we can re-buy in dip with cheap price.
‼️ Comment: #BOME well, Join x2 to x10 base on your fund and have to keep DCA rules in PIN message. Cross X10 for members have fund >= 30k USDT
🚨 Risk warning: Cryptocurrency trading is subject to high market risk. Please make your trades cautiously. I will make my best efforts to give high-quality coins signal, but will not be responsible for your trading losses.
BOMEUSDT trade ideas

BOME Trade Plan for Possible 300% GainThe plan is detailed enough, our goal is to ride the next wave of BINANCE:BOMEUSDT pump.
Set your buy limit orders accordingly.
Follow me and support my ideas for more trade updates.
Let me your thoughts in the comment box.
Cheers!

BOME long 0.01484🚀BOME coin gives a good entry point.
Entry pattern "Breakaway from level"
🤖 First target 0.1948
Further empty. A good impulse is possible!

BOME .0123 so strong and captivatingwhen Bitcoins performs either ways up or down
most coins follow
and this one outperforms during recovery
i think i found the one for 2024 and 2025 to make life changing profits
perhaps another ALPHA of Solana Foundation or Disgressionary funds

bomeusdtSupport and press the rocket to cheer me up
Observe the ten percent loss limit
Stay away from Bitcoins
Feel free to buy and sell and post your comments

BOOK OF MEME alert went off !!!BOME ... ... update ... READY ...
alert went off
stop loss 0.012142
targets 0.017655 / 0.021989 / 0.025605
Been Really busy with my live streams but wanted to
get this chart out to you on tradinview
*** stop loss not recommended but on chart for
traders that don't want to add to entry or have to
wait for price action ( PA ) to return to entry area ( breakeven point )
Not Financial Advice

bomeusdtSupport and press the rocket to cheer me up
Observe the ten percent loss limit
Stay away from Bitcoins
Feel free to buy and sell and post your comments

Bome on fire...... Just see the chart. Its telling you anything 🤫🤫🤫🤫🤫😁😁 see the chart .its will brake all of records

Bullish for Book of MEME (BOME)I am bullish for Book of MEME (BOME) if it breaks symmetrical triangle on 1 hour timeframe.
and has already shown divergence on 1hour timeframe.


Solana Meme Coin Sensation BOME Enters a Bearish CycleIn the latest hour-by-hour analysis of BINANCE:BOMEUSDT , investors have observed a series of fluctuations that paint a nuanced picture of the current market dynamics. The closing prices for the pair have shown a downtrend. This movement suggests a cooling off from initial highs, pushing the crypto into a more volatile phase.
The technical indicators further elucidate this narrative. The 9 Exponential Moving Average (EMA) and the 20 EMA, key indicators for short-term momentum, have both shown a decrease over the last five hours, indicating a bearish trend. The convergence of the 9 and 20 EMAs below the recent closing prices signals a weakening momentum and could suggest a bearish outlook in the near term.
The Moving Average Convergence Divergence (MACD), a tool used to identify potential reversals in market direction, presents a mixed perspective. Initially, the MACD values were close to the signal line, indicating a potential for either direction. However, the histogram, which measures the distance between the MACD and its signal line, has moved from positive to increasingly negative territory, underlining the growing bearish sentiment in the market.
The Relative Strength Index (RSI), hovered around the midline, with recent values dipping slightly below the neutral 50 mark, which could signal a growing bearish momentum or a potential for a reversal if the market finds support.
Key Levels to Watch
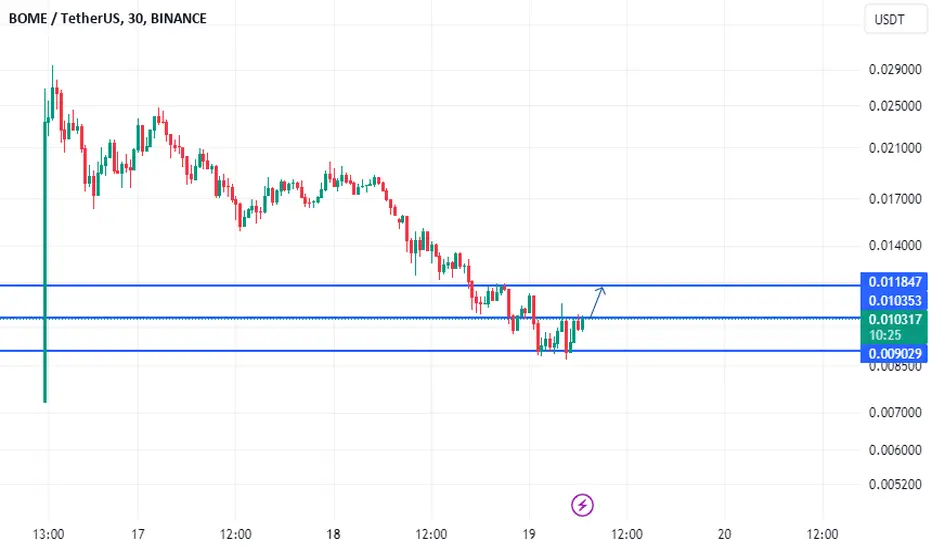
Speaking of support and resistance levels, BOME is currently navigating between critical junctures. The immediate resistance level at $0.012181 could serve as a barrier to upward movement, with further resistance seen at $0.012432 and a more substantial challenge at $0.013081. On the downside, the support level at $0.008991 marks a crucial point that could halt further declines and possibly serve as a springboard for a bullish reversal if the price action finds footing there.
For traders eyeing entry and exit points, the current setup suggests waiting for a clearer signal. For bullish traders, a break above the immediate resistance at $0.012181 could open up opportunities towards higher levels, while maintaining stop losses just below the $0.011572 support level might offer a protective cushion. Conversely, bearish traders might consider entries on a confirmed break below the support level at $0.008991, targeting potential drops, with stop losses placed just above the $0.012181 resistance to mitigate risks.

Let's see what happens if this 1 hr bar closes over 0.012323Let's see what happens if this 1 hr bar closes over 0.012323?
maybe I can get picked up at 0.0123 and head to 25,50, or 90%.
Working on risk management and setting SL before entering a trade.

BOOK OF MEME (BOME) analysisMy analysis of the asset BOOK OF MEME (BOME)
I think the coin will move as I wrote below
1) Declining phase
2) Then the accumulation phase
3) Then strong and dynamic growth with large volumes (Uptrend phase)

bomeusdtSupport and press the rocket to cheer me up
Observe the ten percent loss limit
Stay away from Bitcoins
Feel free to buy and sell and post your comments
BOMEUSDTThe market performance of ECONOMICS:BOME (Book of Meme) continues to exhibit a downward trend. For those considering a long position, it is advisable to exercise prudence and await confirmatory signals before BUYING.
BYBIT:BOMEUSDT.P

BOME - Highly Speculative Play"Book of Meme" a new meme coin that went from $0 to a SEED_TVCODER77_ETHBTCDATA:2B market cap in just 2 days is starting to form a bullish pattern.
After the Binance listing that market the top we have retraced over 60%. We have hit the psychological $0.01 level that could be acting as new support.
We are also near oversold conditions on the lower timeframe and have a bullish divergence on 15 min timeframe. Lower low in price / Higher low on RSI.
We have formed a falling wedge pattern (yellow trendlines that usually break to the upside.
Of course, this is a very risky trade as it is a meme coin, but could have some potential for a nice rebound.


#BOME looking at few setups Have charted this on dexscreener as we have more data there, looking at few setups these are for upcoming dip buying opportunity similar to how we played with PEPE & SHIB
MCAP picture for HTF & if that bigger dip comes around 200M i would like to accumulate
gameplan is simple keep alerts on that channel on 4H, wait for it to breakout & enter or risk some around 0.01 & see how it goes

Quick swing trade - 40% GainsFollowing the pattern that other meme coins, like Pepe, have printed we can see a window of opportunity to gain 40% on our long trade.

BOME UpdateBome moving inside the falling wedge.
Sooner or later will be breakout.
At the moment we going short.
Expecting retest of residence


BOME NEW INCREASE TRENDBOME seems since the least hype trend to make a new increase volume.
We will follow the trend in the coming time frames.

#BOME Two Scenarios#BOME Two Scenarios
Moving in to the Bullish flag.
It will break now or will be pullback from the support zone.
Best opportunity from support zone
