Bonk 1690% shortI see a breakout, and some 5 waves up wich coul be the endof a abc correction. Also went to the 0.5 fib. So from here it should be a nice 1690% gain
BONKUSD trade ideas

BONK About to Explode or Fakeout? Key Levels Are UnfoldingYello, Paradisers! Is #BONK gearing up for a face-melting rally, or is this just another trap designed for emotional traders?
💎BONKUSDT has recently formed a double bottom, a key reversal pattern that often appears before significant bullish momentum kicks in. This comes after a sustained bearish trend, and we’re now seeing signs of strength re-entering the market.
💎What’s even more interesting, a lookalike of skewed triangle pattern is starting to emerge. These often signal continuation of strength, and when paired with an already bullish reversal, it paints a potentially explosive short-term picture.
💎#BONKUSDT is currently sitting on ascending support around the $0.00001980 level. This zone is further bolstered by the EMA-50, adding extra technical significance. If BONK can continue to hold this level, the price is well-positioned to push higher toward the $0.00002470 mark, a moderate resistance zone that could serve as the next stepping stone in this bullish scenario.
💎If BONK clears this resistance with conviction, momentum could pick up rapidly, opening the doors for an aggressive move toward the $0.00003100 to $0.00003400 region. This is a critical profit-taking zone, not only because of historical resistance but also due to a dense confluence of technical barriers.
💎Zooming into the 12-hour timeframe, BONK has just entered a golden cross formation. This bullish crossover is acting as dynamic support, with the $0.00001800 level becoming an important defensive area for price stability moving forward.
Paradisers, strive for consistency, not quick profits. Treat the market as a businessman, not as a gambler.
MyCryptoParadise
iFeel the success🌴

Long Trade Setup – BONKUSD (Bonk) – 30m Chart!📈
🔼 Bias: Bullish
📍 Entry Price: ~0.00002112
🛑 Stop-Loss (SL): 0.00002042 (below white support zone)
🎯 Target Price (TP): 0.00002369
📏 Risk/Reward Ratio: ~1:2.2
🔍 Technical Highlights:
Double-bottom structure on strong support zone (white line)
Breakout from short-term falling wedge (yellow breakout circle ✅)
Volume base forming with support confirmation
Red zone = previous rejection; green = potential upside magnet
🧠 Trade Reasoning:
Clean breakout after consolidation
SL below structure = logical invalidation
TP hits overhead liquidity and prior highs

Bonk B wave to 24?Bonk, after completing a wave 5 up to resistances is Bonk consolidating down to a weekly support and up again to test resistance before another big drop to monthly support and complete another wave 5 down for another higher low?

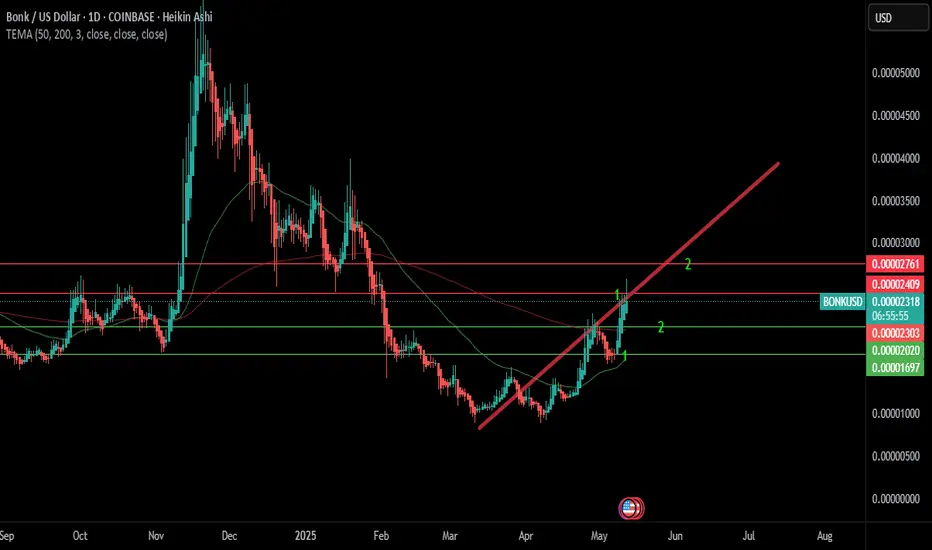
futuras entradas y salidas en bonkEntering the green lines and exiting the red lines taking into account that number 1 was already successful
BONKUSD: Keep an eye out for potential breakoutAs above.
Triangle type formation and near end with testing upper resistance line.
Watching for break out especially above 0.000015 level of next resistance.
BONK has potential to pump and dump fast, so going to need to be fast on entry and exit.
1W MACD additionally looking like turning around and bearish trend reversing on that time frame so far.
Will follow.
Good luck traders.

head up : sharktrade the big jaws like the meme coin : BONKevery crypto kids or crypto enthousist know meme coins but in the meme coin you differents kinds the king is BONK , from yesterdeya we have very good pump and this one could double you portfolio every 6 months , it s already the case for me ...

BONK possible movesI am new to the Elliott wave theory and I am just trying to see if the lines I have could be the possible next moves for BONK.
I am looking forward to see comments of those that know and understand Elliott Wave Theory to see if you all see this as a possibility for BONK.
Thanks in advance.

BONK/USD (1H) - EMA Crossover DCA with Advanced ExitsTrade BONK/USD on the 1H chart with this strategy combining trend entry and Dollar Cost Averaging.
Core Logic:
Entry: Long position initiated on Fast EMA crossing above Slow EMA.
DCA: Averages down entry price by placing up to 2 Safety Orders (funded by specific USD amounts) if price drops. Spacing is configurable via ATR multiples or percentage levels.
Exit: Utilizes a powerful Dual Trailing Stop system to manage profits and risk: a standard wide trail, plus a tighter trail that activates once a specific profit target is hit. Also exits if the trend reverses (EMA crossunder).
Key Settings & Tools:
Customize EMA periods, all trailing stop percentages, and safety order logic (ATR/%, Size).
Enable a Date Filter to restrict trading to specific periods.
Set an Entry Cooldown to avoid immediate re-entry.
Includes an Info Table on the chart for key metrics.
Provides alertcondition outputs potentially usable for automation (e.g., 3Commas) - user must verify/adapt message format.

BONKUSD LONG? Will we a see a dump on BONK/USD before it retests the high's and then makes a new higher high?
Curious.... Exciting to see crypto at these prices.
Long BONKUSD
Might see a pull back in the BONK BUYING ZONE.

BONK - 4hr Bullish Trade SetupIf we get two 4hr closes above the key resistance line, then good probability of a move higher. Three potential targets and suggested stop loss.

We have bottomed at Bikini BottomPossibly a great entry right now, as we have hit Bikini Bottom and Spongebob is telling me, there could be a easy 100% to 200% potential gains to be made!!

BONK: Time to BounceBONK has seen a 75% retracement to the downside since November and is currently holding at support. I would expect a bounce to the upper trend line. A clean break of the trend line would cause a huge move to the upside. Keep an eye at these levels.

300% gains BONK Best Level to BUY/HOLD swing trade setup🔸Hello guys, today let's review daily price chart for BONK. Outlook remains bullish currently pullback in progress, however buying low still is a perfect trade setup.
🔸BONK is one of the top rated solana meme coins. currently undergoing correction and still not complete, however risk/reward is shifting in bulls favor right now. we are close to the floor / reload zone for the bulls.
🔸Recommended strategy bulls: Price action contained within bullish channel. get ready to buy low near 11000/13000, TP is 33000/36000 +300% gain. BUY/HOLD setup for patient traders. keep in mind that BONK already got a heavy valuation, so do not expect miracle overnight gains.
🎁Please hit the like button and
🎁Leave a comment to support our team!
RISK DISCLAIMER:
Trading Futures , Forex, CFDs and Stocks involves a risk of loss.
Please consider carefully if such trading is appropriate for you.
Past performance is not indicative of future results.
Always limit your leverage and use tight stop loss.

BONK Got No Resistent !!If Bonk pull back to the support level I will DCA because bullish momentum still strong. DYOR

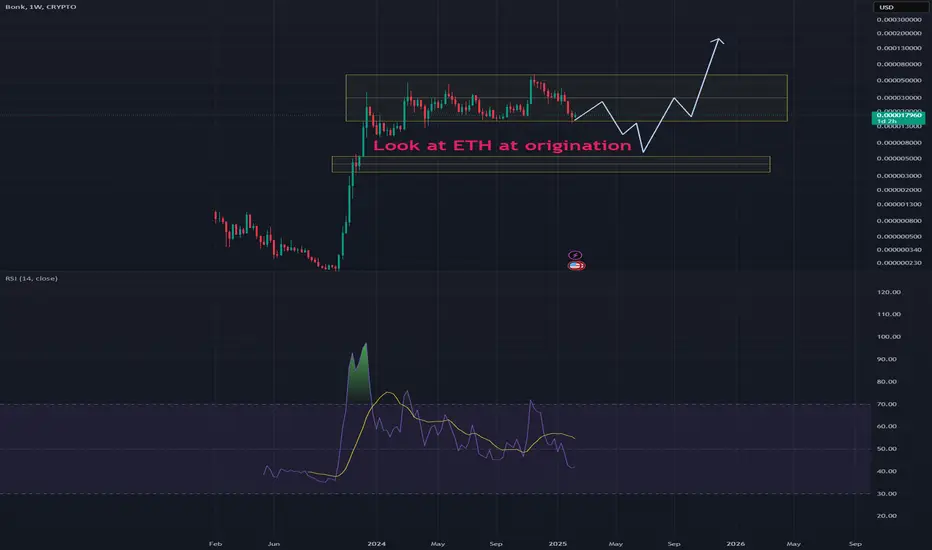
Repeat of ETH at origination, wait for the best time to buy As title reads, this could pan out similar to eth when it first came out and did a large move up. This will consolidate sideways before moving up so get those limit orders right. Expect a wick down.
Demand Level and Key LevelGood day Kind People:
How are you all doing?
BONK is currently consolidating on a key level in the Demand Zone, if we can get a strong breakout from the 10 EMA and from the consolidation, that could probably be a good time to go long. Please see chart for key levels

Bonk rountrip #4Zooming out and looking at the bonk price action. This is now the 4th time it has seen a drop between 60-78%. All the bottoms provided amazing buying opportunities. With a bright year ahead for crypto including Solana ETFs and potentially a Bonk ETF. Buying here seems like a no brainer. May have to wait 7-90 days for it to reverse course based on previous consolidations around the lows.

BONK DRAGON BREAK OUTBONK 12HR is printing a Bullish Dragon Pattern Breakout with volume. Bullish Divergence on the RSI as well.

good things take timeSEED_DONKEYDAN_MARKET_CAP:BONK will explode
just got a robinhood listing, hype has died off, maket makers washing out the jeets.
i believe they burned 52 million dollars of bonk recently
should be in everyone's bag this time around.
very easy play.

Bonk at Key Support, ready to bounceBonk riding along this trend line I drew months ago, if we lose this level there is another trendline around the .000025 level. But.... I favor think support holds, we shall see!

#bonk still downside pending? what's your take on this?I see more downside move pending in bonk as 3rd wave breaks the channel (which is not very fascinating and confidence in crypto), still i am looking one swift move towards up as a wave 4 and wave 5 towards down. let's see what are the future waves that will unfold in upcoming for BONK. keeping eye on BTC tho.

BONK Best Level to BUY/HOLD 300% gains🔸Hello guys, today let's review 12hour price chart for BONK. Outlook remains bullish currently pullback in progress, however buying low still is a perfect trade setup.
🔸BONK is one of the top rated solana meme coins. currently undergoing correction and still not complete, however risk/reward is shifting in bulls favor already.
🔸Recommended strategy bulls: Price action contained within bullish channel. get ready to buy low near 2500, TP is 7500 +300% gain. BUY/HOLD setup for patient traders. keep in mind that BONK already got a heavy valuation, so do not expect miracle overnight gains.
🎁Please hit the like button and
🎁Leave a comment to support our team!
RISK DISCLAIMER:
Trading Futures , Forex, CFDs and Stocks involves a risk of loss.
Please consider carefully if such trading is appropriate for you.
Past performance is not indicative of future results.
Always limit your leverage and use tight stop loss.
