Technical Analysis of Bonk CryptocurrencySeveral factors, including the potential approval of a BONK ETF and the planned burn of 1 trillion tokens upon reaching 1 million holders, have contributed to BONK’s recent price surge.
The price is expected to move toward 0.000035 in the coming days, driven by increasing buying pressure and demand

Bonk In A Good Situation, Breaking Resistance & HigherThe market bottom happened 7-April, it was a double-bottom compared to 11-March 2025. The end of a downtrend signals the start of an uptrend, and BONKUSDT started rising next. Resistance was found mid-May, on the twelve. This led to a correction and the correction ended 22-June as a higher low.
Now

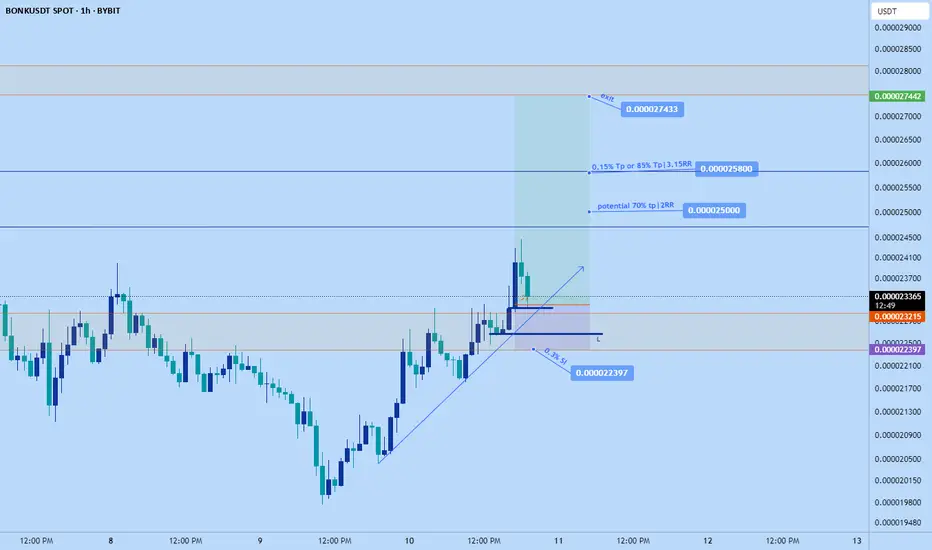
Bonk pump continuationJust opened a long on bonk again.
Stop: $0.022397
Tagets are on chart.
Time sensitive
Is Bonk ready for a 23% breakout toward 0.000030?Hello✌
let’s dive into a full analysis of the upcoming price potential for Bonk📈.
BINANCE:BONKUSDT has recently broken through multiple daily resistance levels in a sharp upward move 🚀, resembling a strong breakout rally. The price is now pulling back toward a key daily support area, which also a

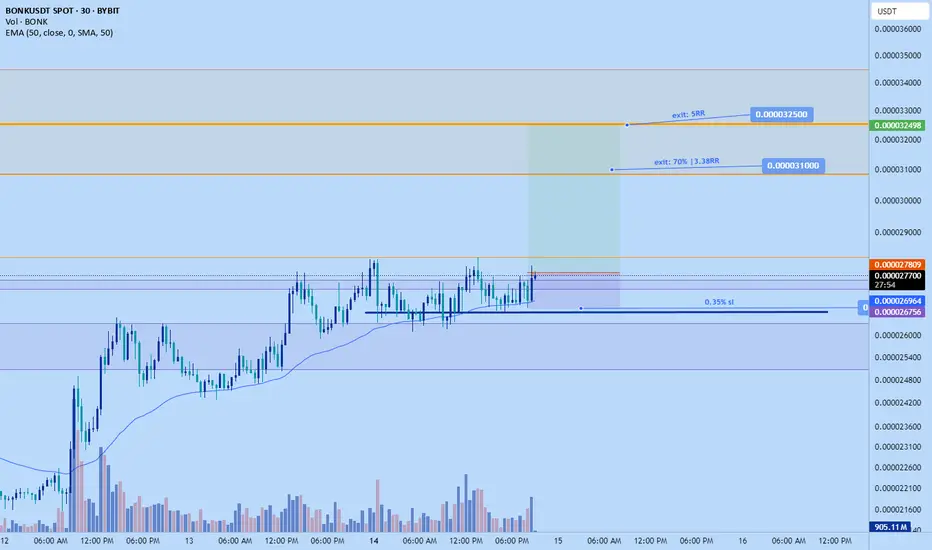
Bonk long to $0.0000325Just now hopped into a long position on bonk. Aiming for $0.0000325. However looking to scale out 70% around $0.000031.
Breakout likely to happen soon, maybe next hr based on my DTT analysis
Stop: $0.000026756 or lower
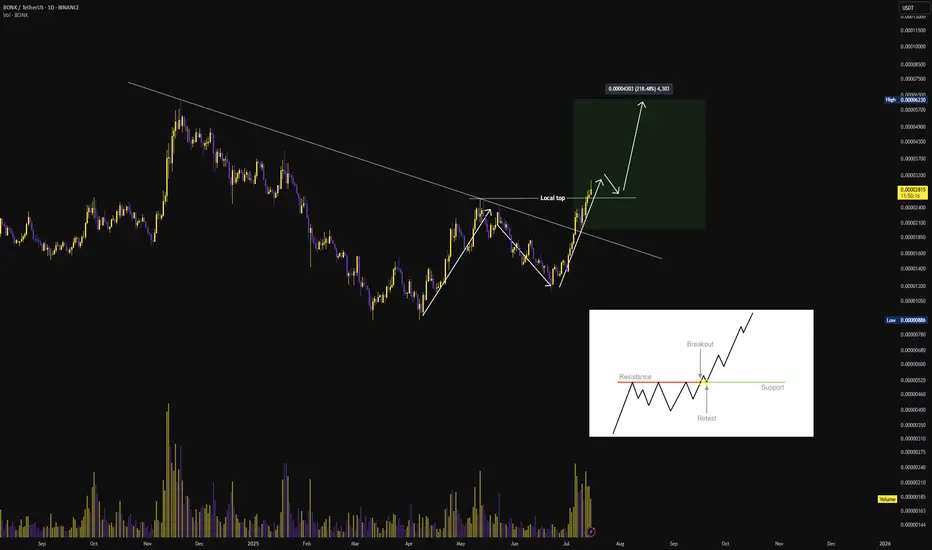
$BONK Breakout and Retest Structure
BONK has executed a clean breakout above the multi-month descending trendline, supported by increasing volume and momentum. The asset has also reclaimed the prior local top, indicating a structural shift in market direction.
Price is now approaching a critical retest zone near the breakout level.
Bonk FLYBonk
BONK is a meme coin launched on Solana in December 2022, distributed to build community and liquidity within the ecosystem
Everything is clear on the chart.
It's time to fly.
I wish everyone abundant profits.
Like and follow
for more.

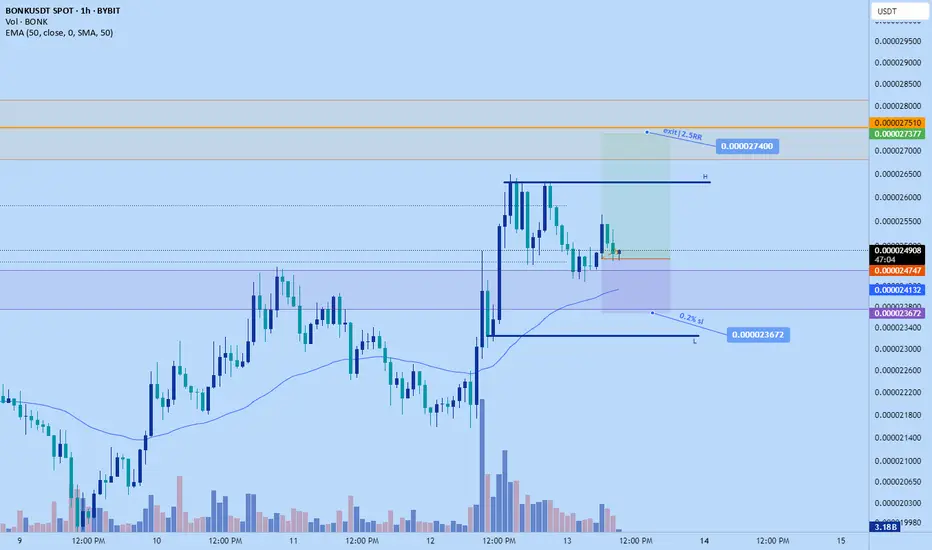
Bonk long to $0.0000274 todayJust now opened up a long position on bonk. Aiming for $0.0274 area
Stop: $0.000023672
roughly 2.5RR from my entry.
Market is at a good area of potential support. Its prior daily resistance that held very strongly in the past and was broken recently with a lot of volume, already gave some signal
Bonk Price is up 30%The price of CRYPTOCAP:BONK Coin has reached double its demand, where lies the resistance – Major Change of Character.
Read more here:
www.cointrust.com

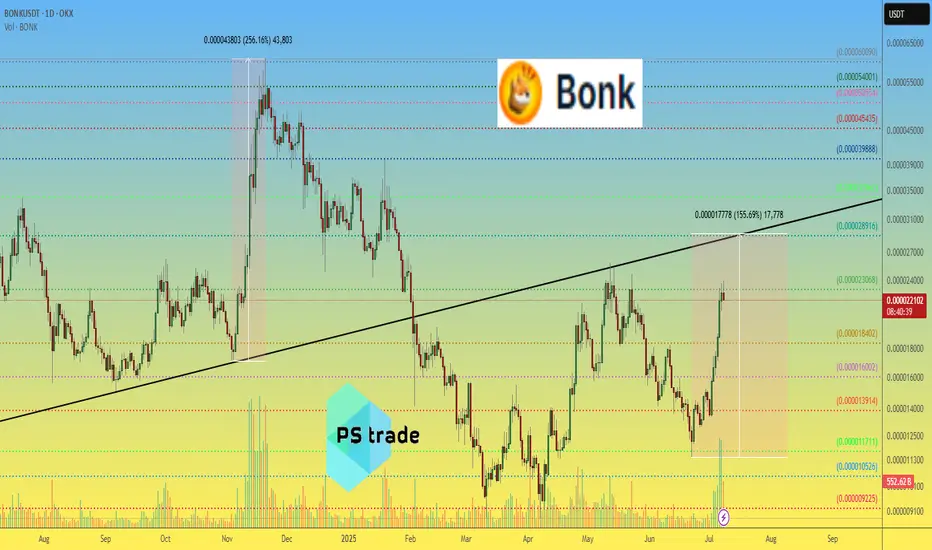
BONK price analysis “Someone” decide to revive the price of CRYPTOCAP:BONK , or are there fundamental reasons for this? (Please share your thoughts in the comments.)
📈 However, the last time there was such a powerful surge in trading volume on the OKX:BONKUSDT chart, the price managed to gain +256% in just over tw
See all ideas
Summarizing what the indicators are suggesting.
Oscillators
Neutral
SellBuy
Strong sellStrong buy
Strong sellSellNeutralBuyStrong buy
Oscillators
Neutral
SellBuy
Strong sellStrong buy
Strong sellSellNeutralBuyStrong buy
Summary
Neutral
SellBuy
Strong sellStrong buy
Strong sellSellNeutralBuyStrong buy
Summary
Neutral
SellBuy
Strong sellStrong buy
Strong sellSellNeutralBuyStrong buy
Summary
Neutral
SellBuy
Strong sellStrong buy
Strong sellSellNeutralBuyStrong buy
Moving Averages
Neutral
SellBuy
Strong sellStrong buy
Strong sellSellNeutralBuyStrong buy
Moving Averages
Neutral
SellBuy
Strong sellStrong buy
Strong sellSellNeutralBuyStrong buy
Displays a symbol's price movements over previous years to identify recurring trends.