Will BONK hit 36% gain and reach 0.000020 soon?Hello and greetings to all the crypto enthusiasts, ✌
let’s dive into a full analysis of the upcoming price potential for BONK 🔍📈.
BONK shows strong potential as it approaches a key breakout point. The price is testing the upper boundary of a descending channel, and a successful breakout could pus

BONK/USDT Technical Analysis (12h timeframe)This setup is based on a multi-factor method combining structure, RSI level, liquidity zones, and active narrative catalysts.
🧠 Method used:
• Identified a potential double bottom on strong historical support
• RSI < 40 on 12h TF → ideal zone for accumulation
• Price compression near key support le

BONKUSDT Forming Falling WedgeBONKUSDT is catching the attention of savvy crypto traders as it displays a classic falling wedge pattern, a well-known bullish reversal signal. This technical setup suggests that the prolonged downtrend could be nearing exhaustion, opening the door for a significant upside move. With good trading v

BONKUSDTCryptocurrency Futures Market Disclaimer 🚨🚨🚨
Trading cryptocurrency futures involves high risks and is not suitable for all investors.
Cryptocurrency prices are highly volatile, which can lead to significant gains or losses in a short period.
Before engaging in crypto futures trading, consider you
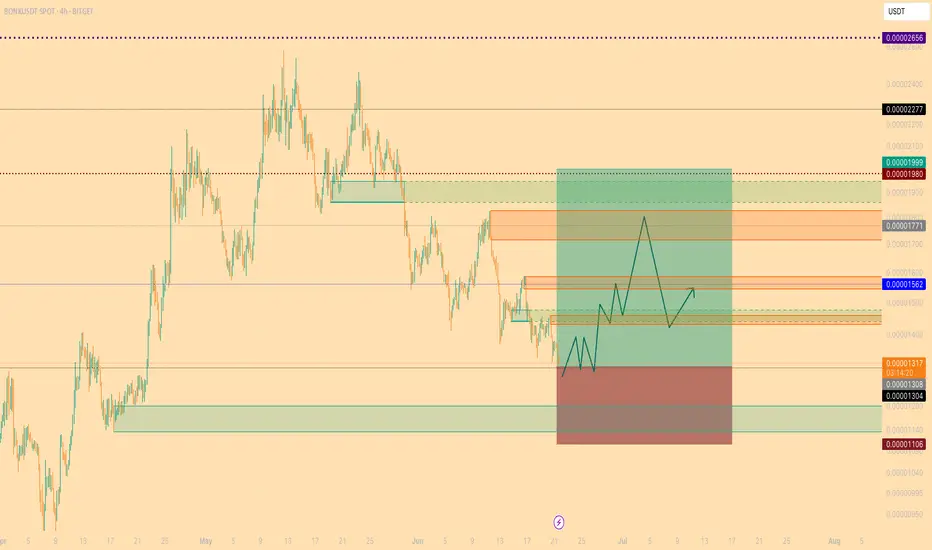
BONKUSDT | Long Setup – Fib Support + Price Action Scenario📈 BONKUSDT | Long Setup – Fib Support + Price Action Scenario
I usually avoid trading meme coins from the Solana ecosystem, but many SOL-based memes are currently sitting at technically significant support levels — and BONK is one of them.
🔹 Price has retraced into the 0.618 – 0.65 Fibonacci suppo
BONK/USDT Reaches Critical Juncture-Will it Rise?Bonk bulls prevented an excessive price plunge and triggered a rebound from $0.00001152, surging by over 50%. Currently, the memecoin has risen above a pivotal resistance zone, and a daily close above the levels may validate the start of a bullish trend. However, the bears are extracting the profit,

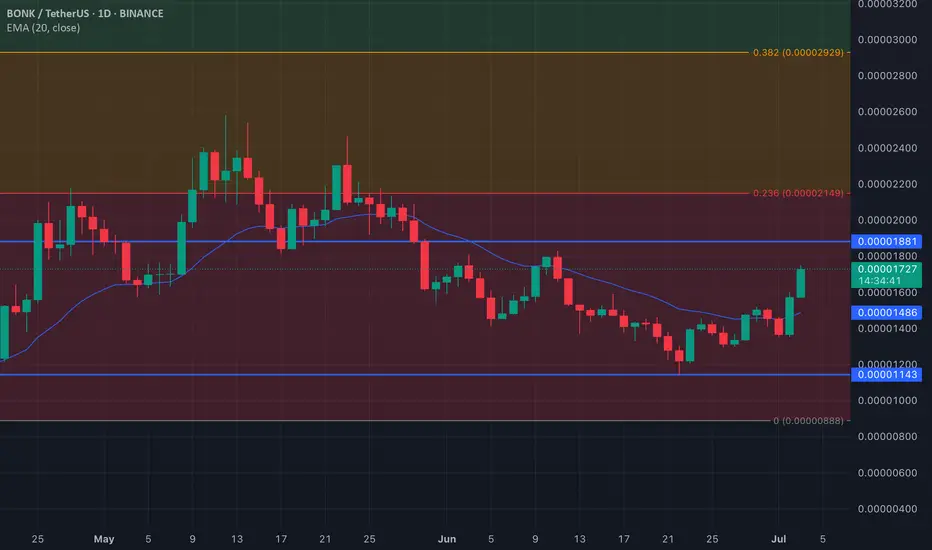
BONK Price Climbs Above 20-Day EMABONK has broken above its 20-day Exponential Moving Average (EMA), now acting as dynamic support at $0.000014. This move indicates short-term bullish momentum, as trading above the 20-day EMA typically suggests increased buying pressure.
If bulls maintain control, BONK could rally toward the $0.000
BONK/USDTThis time, we reached a resistance area for this currency and I think this currency has the potential to be bullish. I have specified the target for you. Remember, this is an analysis, not an entry point. Tell me your opinion.

BONKUSDT Make A Falling Wedge Pattern In 4H Chart#BONK
Make a clean bullish Falling Wedge pattern on the 4H chart & Breakout It.Now We can Get a Long Position.
My profit Target
1 Target - $ 0.0001803
2 Target - $ 0.0001929
3 Target - $ 0.0002058
4 Target - $ 0.0002205
5 Target - $ 0.0002335

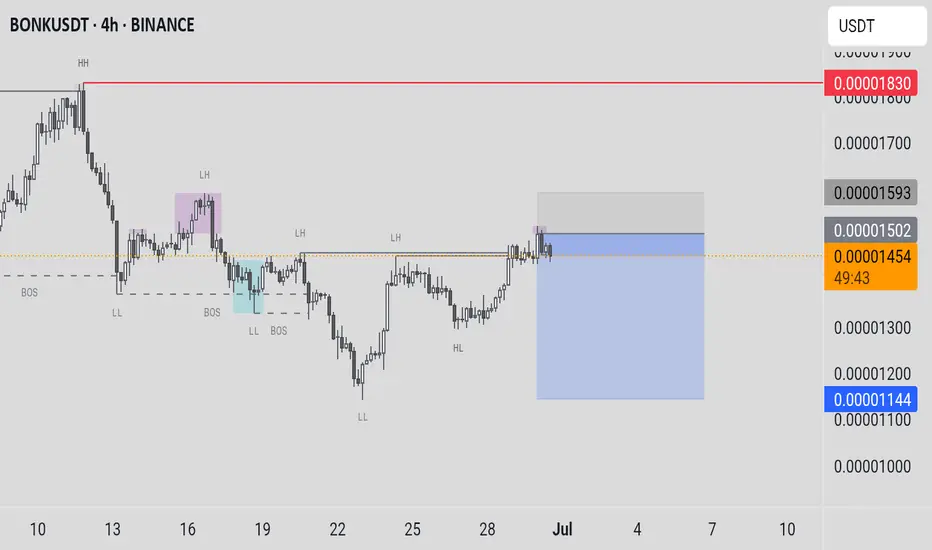
BONK – Long Here, Patience RequiredTime to go long on $BONK.
Hard not to bid at this level—the risk/reward is solid.
Still expecting some range-bound price action before the real move kicks in, so patience is key here.
First target: the yearly open—nearly a 2x from current levels. BINANCE:BONKUSDT

See all ideas
Summarizing what the indicators are suggesting.
Oscillators
Neutral
SellBuy
Strong sellStrong buy
Strong sellSellNeutralBuyStrong buy
Oscillators
Neutral
SellBuy
Strong sellStrong buy
Strong sellSellNeutralBuyStrong buy
Summary
Neutral
SellBuy
Strong sellStrong buy
Strong sellSellNeutralBuyStrong buy
Summary
Neutral
SellBuy
Strong sellStrong buy
Strong sellSellNeutralBuyStrong buy
Summary
Neutral
SellBuy
Strong sellStrong buy
Strong sellSellNeutralBuyStrong buy
Moving Averages
Neutral
SellBuy
Strong sellStrong buy
Strong sellSellNeutralBuyStrong buy
Moving Averages
Neutral
SellBuy
Strong sellStrong buy
Strong sellSellNeutralBuyStrong buy
Displays a symbol's price movements over previous years to identify recurring trends.