BONK/USDT Bullish Analysis 🚀 BONK/USDT Bullish Analysis 🚀
📈 Key Bullish Factors: 🔹 📊 Fibonacci Levels: Price near 0️⃣ (0.0000885)—potential targets 0️⃣.382 (0.0001869) & 0️⃣.618 (0.0002961) 🔹 📈 Volume Spike: Increased trading activity = strong market demand 🔹 📉 Moving Averages: A breakout above 200-day MA confirms bullish trend 🔹 🔥 Candlestick Pattern: Strong bullish candles = High buying pressure
💡 Bullish Scenario: ✅ If 0.000035 resistance breaks → targets 0.00004 then 0.0000485 💥 ✅ If surpasses 🚀 0.0000485, next major milestone ✨ 0.0000623
🛡️ Support Levels: 🔸 Correction → Key support at 0.000022 💎 Hold = Bullish momentum continues
⚡ Momentum is building! Are we ready for liftoff? 🚀🌕💰
BONKUSDT trade ideas

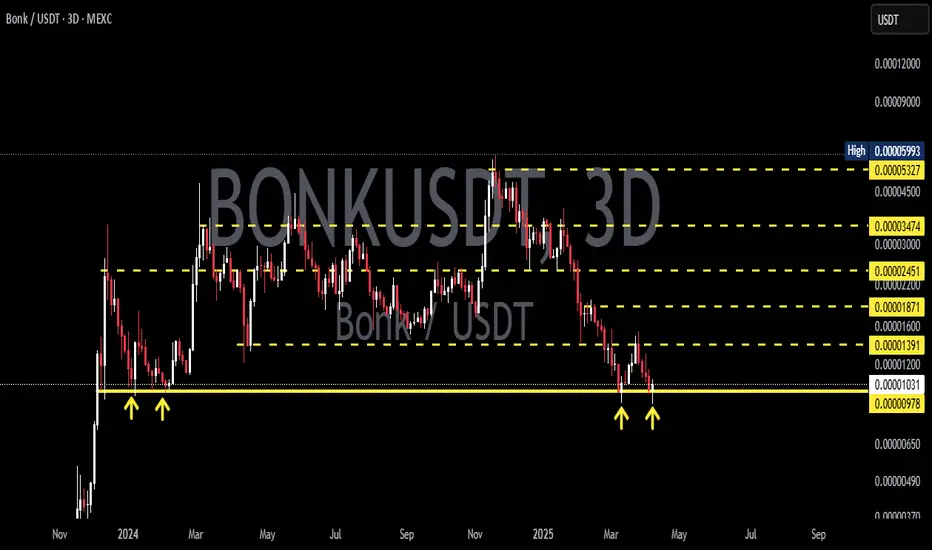
Bonk at Floor Price - 2x to 3x Pump Incoming?SEED_DONKEYDAN_MARKET_CAP:BONK has retested its 2024 floor price at $0.00001 - a zone that previously triggered strong upward moves. Could this be a reliable support once again and spark a 2x to 3x bounce from current market price at $0.00001135?
What's your take - bounce or breakdown from here?
Share your thoughts below!
Kindly support this idea with a LIKE👍 if you find it useful🥳
Happy Trading💰🥳🤗

$BONKUSDT back to ATH!!!Having broken a long term bearish trendline and a resistance zone as well. BINANCE:BONKUSDT has retested this resistance zone, turning it to support. It has turned bullish and fully ready to push back to its ATH and above.
Be on the look out and expect minor retracements while at it, as there are some support and resistance zones it can bounce off from. These zones are already marked out in the setup.
Kindly support this analysis to enable it reach to other people, and do comment your thoughts.

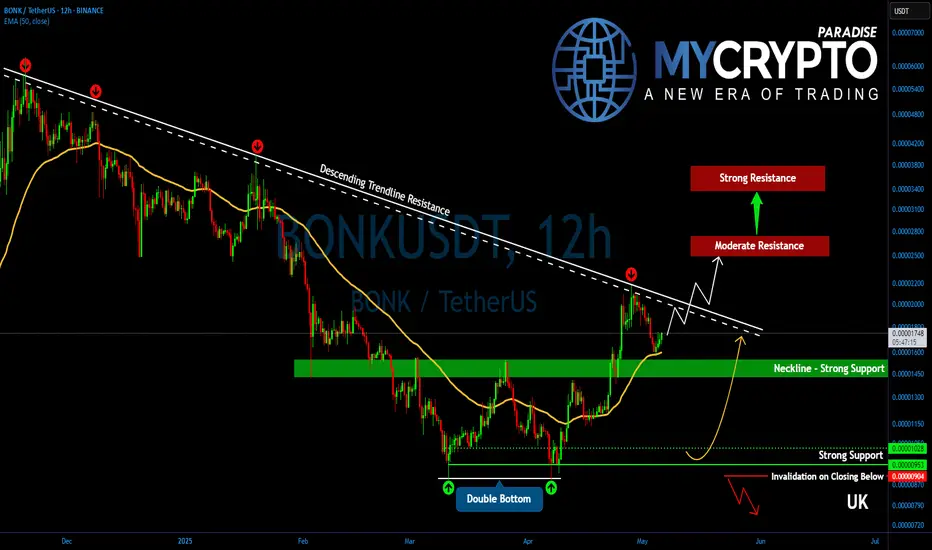
BONKUSDT Up for a Major Breakout! Key Levels to Watch!Yello, Paradisers! Is #BONK about to explode higher after weeks of consolidation? A powerful shift is underway—and the bulls might just be waking up at the perfect time.
💎#BONKUSDT is beginning to show a notable short-term trend reversal, with a double bottom pattern now confirmed. This structure signals a potential end to the recent bearish control, and price action is now pressing against the descending trendline resistance. A successful breakout here could completely flip market dynamics in favor of the bulls.
💎Following a minor round of profit-taking at the descending resistance, BONK pulled back toward the previous breakout support. That retracement brought the price right back into the key supportive range between 0.00001550 and 0.00001425, where it's now starting to bounce again. Notably, the EMA-50 has aligned perfectly with this support zone, adding strength to the reaction from this area.
💎BONKUSDT's next challenge lies at 0.00002000 to 0.00002100—a major descending resistance level that has capped upside since December 2024. Breaking above this structure would be a critical bullish breakout, potentially unleashing the next wave of upside momentum.
💎If bulls push through this barrier, BONK is expected to move toward the next moderate resistance at 0.00002500 to 0.00002750. This area aligns with the measured target of the double bottom formation. However, if bullish strength continues to build, BONK may even extend toward the strong resistance between 0.00003400 and 0.00003700, where the 50% Fibonacci retracement also resides—a historically significant level for potential trend reversals.
💎Adding to the bullish case, the 12-hour EMA-50 and EMA-200 are now converging toward a possible Golden Cross. If this cross confirms, it could serve as a major technical catalyst for a broader trend reversal and further upside continuation.
Paradisers, strive for consistency, not quick profits. Treat the market as a businessman, not as a gambler.
MyCryptoParadise
iFeel the success🌴

#BONK/USDT#BONK
The price is moving within a descending channel on the 1-hour frame and is expected to break and continue upward.
We have a trend to stabilize above the 100 moving average once again.
We have a downtrend on the RSI indicator that supports the upward move with a breakout.
We have a support area at the lower boundary of the channel at 0.00001825, which acts as strong support from which the price can rebound.
Entry price: 0.00001883
First target: 0.00001967
Second target: 0.00002078
Third target: 0.00002222

BONK ONCE AGAIN MAKING INTERESTING PATTERNSA 90% loss is a very real potential. A 500% gain is a very real potential. Breaking even is a very real potential.
To be clear, the only thing I'm recommending right now: Observe, Do Your Own Research, Keep an open mind, Be kind.
Stay Slick

$BONK here loks good for another 1000%SEED_DONKEYDAN_MARKET_CAP:BONK here looks good for another 1000%; cluster of htf levels with declining sell volume.
A run to ATH is 500%, and beyond to the fibs is over 1000%.
Easy invalidation just below pink yearly line.

Bonk targetsWe need to go and trade above 120, that ill open a first target to 190-200 and a second target to 250-260 zone. Overall Bonk looks very good now.

BONK Price Compression Signals Imminent ExpansionBONKUSDT continues to respect its ascending channel structure, recently bouncing from the immediate demand zone. We're eyeing a possible retest of the projected sell-off zone where the next big move will be defined. A bullish breakout here could ignite a rally toward the 0.00096906 mark, while rejection may drag price down to the strong demand zone at 0.00000365. All eyes on this key range—BONK’s next macro impulse is loading. Let’s see how it unfolds.

BONK ON TRONK OR BOUT TO FLONK? SEEMS BULLISH TO MEA lot of big time supports have been reached, and this little crypto has somehow survived. What is next?
I wouldn't be surprised if it went up by 20% or even 200%.

Breaking: Bonk Inu ($BONK) Spike 17% Reclaims $1 Bln Market CapBuilt and integrated in the Solana blockchain before migrating to 7 other chains, the dog-themed meme coin Bonk Inu ( SEED_DONKEYDAN_MARKET_CAP:BONK ) saw a notable uptick of 17% to reclaim the $1 Billion market cap. This was hours after its rival $FARTCOIN reclaims the $1 Billion market.
SEED_DONKEYDAN_MARKET_CAP:BONK has seen a +15964.82% uptick since listing, before retracing losing about 85% of market value. With increasing momentum, SEED_DONKEYDAN_MARKET_CAP:BONK is set to continue the bullish sojourn should the memecoin break the $0.00001555 resistant point. This point is serving as the stronghold for SEED_DONKEYDAN_MARKET_CAP:BONK albeit the general crypto market is in a bullish momentum with CRYPTOCAP:BTC , CRYPTOCAP:SOL , and CRYPTOCAP:ETH all seeing notable price upticks today.
SEED_DONKEYDAN_MARKET_CAP:BONK 's RSI is presently at 78 placing it slightly in overbought territories and also primed for a continuation trend. The asset is trading above key moving averages (MA) enroute to breaking the resistant point to pave way for a bullish campaign for $BONK.
What Is Bonk (BONK)?
According to the one-pager, BONK is the first dog-themed coin on Solana "for the people, by the people" with 50% of the total supply of the cryptocurrency airdropped to the Solana community. BONK is similar to Shiba Inu (SHIB) and Dogecoin (DOGE) memecoins, it was launched on December 25, 2022, and led to an increase in the price of the SOL token (a rise of 34% in 48 hours). Trading began on December 30, 2022, arousing genuine interest from the crypto community.
Bonk Price Data
The Bonk price today is $0.000015 USD with a 24-hour trading volume of $218,248,216 USD. Bonk is up 19.01% in the last 24 hours. The current CoinMarketCap ranking is #62, with a market cap of $1,162,183,290 USD. It has a circulating supply of 78,658,296,511,158 BONK coins and a max. supply of 88,872,433,754,423 BONK coins.

$BONK: Prepping for a Potential Explosive Move🚀 SEED_DONKEYDAN_MARKET_CAP:BONK : Prepping for a Potential Explosive Move
SEED_DONKEYDAN_MARKET_CAP:BONK is known for its wild, high-volatility pumps—and we may be approaching another one.
After a significant bearish divergence on the daily chart, SEED_DONKEYDAN_MARKET_CAP:BONK has retraced to levels lower than last year. However, it's important to remember: SEED_DONKEYDAN_MARKET_CAP:BONK is the original meme coin of the Solana ecosystem, and it's strongly supported by Solana whales.
📈 If CRYPTOCAP:SOL rallies, SEED_DONKEYDAN_MARKET_CAP:BONK usually follows.
While a new all-time high might be out of reach in the short term, a significant move to the upside is on the table. Here's why:
✅ RSI is rising, forming a bullish divergence
✅ Price has entered my 2025 buy zone
✅ MACD has just crossed bullish on the 1D timeframe
✅ Volume is low, often a precursor to explosive moves
✅ CRYPTOCAP:OTHERS index is showing signs of strength—altcoin momentum is building
🧠 If momentum picks up, we could see a 2x to 3x move from current levels.
📌 Keep an eye on this one. As always, DYOR.
#BONK #Solana #MemeCoin #Altcoins #CryptoTrading #CryptoSignals #BONKArmy #MACD #RSI #DYOR #Altseason #CryptoAnalysis

Bonk/Usdt.dA great buy in my humble opinion. Broke daily resistance a while ago and about to leave the accumulation phase.
Where is your minimum risk to return on a chart like this?

Bonk AnalysisMany believe that the market has grown and has ended a few thousand percent, but I believe that the main market growth has not yet begun, so it is up to it that whatever has been given to it.
Bonk is one of them.
Everything in the characteristic picture.
This is just a prediction, not a prophecy

BONK Bottoming? Key Monthly Support May Trigger Bullish ReversalBONK is currently trading in a manner that suggests a significant shift may be underway. After a prolonged downtrend, the monthly chart has printed a potential double bottom at a key support level. This classic bottoming pattern could be the foundation for a bullish reversal if the structure holds and confirms a bullish retest in the coming sessions.
Key Points Covered in This Article:
BONK has formed a double bottom on the monthly timeframe
A bullish retest above support would confirm a higher low
Potential for a rotation back toward February’s highs if structure holds
Price action is currently hovering above the double bottom support zone, which has been respected twice, forming a strong base. If this level continues to hold and a bullish retest confirms, this would indicate a new higher low — a bullish market structure shift after a lengthy corrective phase.
Structurally, BONK appears to be trading within a defined range, and the recent lows may mark the bottom of that range. A move above the February 25 high would validate the range structure and open up the pathway for a sustained rally, potentially targeting higher resistance levels on the weekly and monthly timeframes.
However, volume and momentum confirmation will be key. A breakout without strong volume could risk a deviation and trap traders. On the other hand, a clean retest and follow-through could offer an optimal long setup for those seeking exposure to the next leg up in BONK’s price action.
What to Expect in the Coming Price Action
Traders should watch for price to hold above the double bottom zone and look for confirmation via a bullish retest. If successful, BONK may begin a rotation toward the February highs and beyond, presenting a potentially strong mid-term trading opportunity.

#BONK: Riding the Hype of Solana’s Meme Token*Description**:
This trading idea centers on **BONK**, a meme-based cryptocurrency built on the **Solana** blockchain that has gained popularity for its community-driven nature and viral appeal. As Solana continues to grow in adoption due to its speed and low fees, tokens like **BONK** benefit from network momentum and visibility. Unlike many meme tokens, **BONK** is increasingly being integrated into various DeFi and NFT ecosystems, giving it utility beyond speculation. Its fair distribution model and strong engagement from developers and users make it a notable player in the meme coin space.
Despite its growth, it’s important to recognize that meme tokens like **BONK** are highly volatile and influenced heavily by community sentiment, social media trends, and broader crypto market cycles. The potential for high rewards comes with high risks, and price movements can be unpredictable and rapid.
**Disclaimer**:
This trading idea is for educational purposes only and does not represent financial advice. Investing in cryptocurrencies like **BONK** involves significant risk, including the possibility of total capital loss. Always perform your own research, understand the dynamics of the token, and consult a licensed financial advisor before making any investment decisions. Past performance is not indicative of future results.

BONKUSDT 3DBONK ~ 3D Analysis
#BONK Important support that must be maintained for now. bouncing from here a short -term target of at least 15%+.
BONKUSDTmy entry on this trade idea is taken from a point of interest above an inducement (X).. I extended my stoploss area to cover for the whole swing as price can target the liquidity there before going as I anticipate.. just a trade idea, not financial advise
Entry; $0.00001183
Take Profit; $0.00001040
Stop Loss; $0.00001310

BONKUSDT 45Price is currently at potential zone with algorithm printed 92% probability for long.
Targets and stoploss are mentioned.
Manage your risk

#BONK: Riding the Hype of Solana’s Meme CoinDescription:
This trading idea is centered on BONK, a meme coin that has rapidly gained popularity within the Solana ecosystem. Designed as a community-driven token, BONK benefits from strong engagement, widespread airdrops, and increasing utility within Solana’s DeFi and NFT markets. As meme coins often thrive on social sentiment and viral adoption, BONK has positioned itself as a potential high-reward asset, fueled by its active community and integration into various Solana-based platforms. The token's association with a fast, low-cost blockchain like Solana adds further appeal.
However, meme coins are highly speculative and subject to extreme volatility, making them particularly sensitive to market sentiment, trends, and broader crypto fluctuations. While BONK presents significant upside potential, investors must approach with caution, as price movements can be unpredictable.
Disclaimer:
This trading idea is for educational purposes only and should not be considered financial advice. Investing in cryptocurrencies like BONK involves substantial risk, including the potential for total capital loss. Always conduct thorough research, evaluate your financial situation, and seek professional financial advice before making investment decisions. Past performance is not indicative of future results.

Bonk time for pump Bonk has hit support and is ready for a bounce. Aiming for a bounce of 30% or more.
The downtrend is over now, Its up only

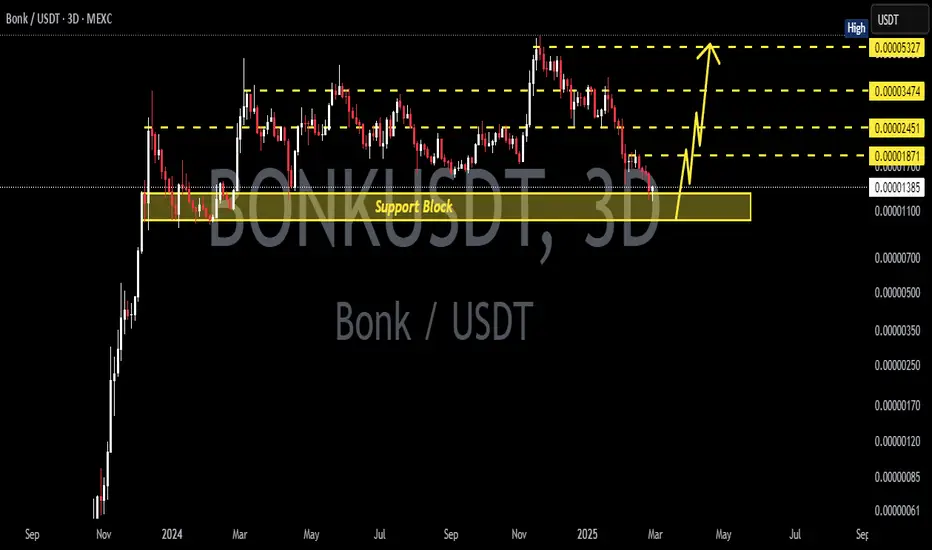
BONKUSDT 3DBONK ~ 3D Analysis
#BONK Buy gradually from here if you still have a Conviction on this coin.
Reason, This support block is still maintained.