BONDWait for the trend to break through
After that, we enter buy
Objectives:
0.0000632
0.0000978
Stop loss:
The four-hour candle closed below 0.00003660
BONKUST trade ideas

BONKUSDTmy entry on this trade idea is taken from a point of interest BELOW an inducement.. I extended my stoploss area to cover for the whole swing as price can target the liquidity there before going as i anticipate.. just a trade idea, not financial advise

Bullish flag for bonkBonk Coin is showing a **Bullish Flag** pattern, which is a good sign for potential price growth. The **Bullish Flag** happens after a sharp rise in price, followed by a period of calm or sideways movement, like a flag on a pole. This pattern suggests that the coin might be getting ready to go up again after this short pause.
For Bonk, this could mean that after the recent price increase, it's now consolidating (moving sideways), and it might soon break out higher. Traders usually look for the price to move above the top of the flag to confirm the pattern and expect the price to rise again.
However, just because the flag is there doesn’t guarantee the price will go up. It’s important for traders to watch for confirmation, like higher volume or momentum, before making a move.
In short, the **Bullish Flag** pattern for Bonk Coin suggests it could keep going up, but it’s important to be cautious and look for signs that the pattern is playing out.

Bonk/USDT Price Prediction (update)Bonk/USDT Price Prediction
Trend Prediction - Bonk/USDT Forecasting
Resistance and Support Lines Falling Wedge Pattern
**** Yousef Sharafi ****
Follow me here for more analysis

Bonkusdt for buyPrice is an uptrend, it formed a descending triangle, price broke out of the bearish trendline and formed a triple bottom. TP and S.L parameters are set.

Analysis of $BONK/USDTAnalysis of $BONK/USDT
Current Price : $0.00005097
Key Levels:
Buy Zone: Around $0.00003912, marked as an ideal entry point if the price dips further.
T1 (Target 1): $0.00006252
T2 (Target 2): $0.00007275
T3 (Target 3): $0.00008317
A bullish scenario is expected after a pullback to the buy zone or Fibonacci support levels. Targets are set based on projected upward momentum.

Bonk on the move in the 3rd wave
Hello traders!
this is the first time i publish idea!
Accourding to my wave count we are in the middle off the 3rd wave off the 3rd and the first wave is completed off the 3rd.
As you can see i put some lines as some support and my target for the 3rd is 261.80%
measured from the bottom off the whole move.
Is it going to blast through or stopp were i put the yellow line?
it will be fun to see later when i come back later on.
This is not about being right just for entertainment only!
The chart is always going to do its own thing why not enjoy it as well and just see?
If it stopps att the yellow line thats a profit off 517%!
Right now we are half way through
This is not financial advise!
You should always do your own count!
Have a nice sunday!
H


BONK Price Soars 12% Post-Major ListingThe Solana-based meme coin CRYPTOCAP:BONK is making waves in the cryptocurrency market. After its listing on South Korea’s largest crypto exchange, Upbit, the coin has surged by 12% in a single day, reaching a new all-time high. This recent rally has extended BONK’s weekly gains to over 75%, sparking optimism for its potential to challenge the giants of the meme coin market like PEPE and SHIB.
The Catalyst Behind BONK’s Rally
The Upbit listing has proven to be a game-changer for CRYPTOCAP:BONK , as the Korean exchange announced the addition of a BONK-Korean Won trading pair. With Korean investors’ affinity for meme coins, this move has significantly boosted trading activity and investor confidence.
- Massive Volume Surge: BONK’s daily trading volume has soared by 77%, crossing the $2.7 billion mark.
- Whale Activity: Blockchain analytics platform Lookonchain reported notable whale interest. A well-known investor, famous for $4.84 million profits from POPCAT, recently acquired 65.4 billion BONK tokens worth 3.4 million USDC, signaling strong confidence in BONK’s potential.
- Market Cap Milestone: BONK’s market cap now exceeds $4.2 billion, ranking it as the fourth-largest meme coin. Analysts predict it could climb to $10 billion, positioning it among the top three meme coins.
Technical Analysis
BONK has consistently followed a cycle of falling wedges followed by rising wedges. This pattern has occurred three times, each signaling a breakout to new highs.
CRYPTOCAP:BONK is currently positioned for a healthy retracement to the $0.000051 support level before potentially climbing further. The Relative Strength Index suggests room for retracement or a continuation of the bullish trend. Furthermore, BONK’s 24-hour trading volume surged by 117.24%, reflecting strong investor interest and liquidity.
With BONK currently trading at $0.0000559, analysts see potential for the price to move towards $0.005 in the long term, fueled by its increasing adoption, whale interest, and strong technical foundation.
Upbit Listing Amid Regulatory Scrutiny
Interestingly, this development comes as Upbit faces regulatory challenges. South Korea’s Financial Intelligence Unit has flagged over 500,000 KYC violations by the exchange. Despite this, the CRYPTOCAP:BONK listing has ignited investor enthusiasm and strengthened the coin’s community.
Conclusion
BONK has displayed a rare mix of healthy technical patterns, growing fundamentals, and increasing adoption. The combination of whale activity, a major exchange listing, and sustained volume growth suggests BONK is well-positioned to capitalize on the meme coin trend. With a market cap of $4.2 billion and growing, the $10 billion milestone could soon be within reach.
Investors are keeping a close watch on BONK’s next moves, as it continues to solidify its position in the meme coin hierarchy. Will BONK challenge PEPE and SHIB? Only time will tell, but the momentum is undeniably strong.

BONKUSDT: Potential for a 30-50x Surge!Overview:
BONK/USDT, the second-largest meme coin on the Solana network has shown promising signs of a significant upward trend, as indicated by the recent breakout from both weekly resistance lines. The price action suggests a refusal to decline further, highlighting a potential bullish momentum.
Technical Analysis:
-The chart demonstrates a clear breakout above the yellow resistance line, which has historically acted as a ceiling for price movements.
- The weekly candle has closed above this line, indicating strong buying pressure and potential for further gains.
- The price has also surpassed the horizontal resistance at 0.00004790, reinforcing the bullish outlook.
Market Sentiment:
With the current momentum and market interest, BONK/USDT could see a substantial increase, potentially reaching 30-50 times(+) its current value. However, it's crucial to acknowledge the inherent risks in such high-volatility trades.
Risk Assessment:
While the technical indicators are favorable, this is a high-risk trade. Market conditions can change rapidly, and it's essential to conduct thorough research and consider your risk tolerance before investing.
Conclusion:
BONK/USDT presents an exciting opportunity for traders willing to embrace the risks for potentially high returns. Keep a close watch on market developments and adjust your strategies accordingly.

BONK: will the 1 trillion token burn fuel price growth?The Solana (SOL)-based memecoin BONK rallied 100% in the past seven days, driven by an overall market pump and a massive deflationary plan to burn 1 trillion tokens.
On 15th November, Bonk DAO announced the deflationary plans with the 2024 Christmas deadline.
Immediately after the news, BONK pumped 27% and added on its weekly gains, which crossed 100% amid an extra weekend pump. For context, burning tokens reduces supply and ultimately boosts the value of the remaining assets.
The extra pump on Sunday eyed the immediate bullish target of $0.000057 on the Fib tool. If the uptrend extended, the next target would be $0.000067, offering an extra 40% potential gains.
But BONK grabbing the extra gains could only be feasible if the mememcoin stayed above its previous ATH.
That said, technical indicators showed massive buying interest but an overheated market scenario. The Stochastic RSI was in oversold territory, while the OBV (On Balance Volume) reached new highs.
Interestingly, leveraged bulls also FOMO’ed on the BONK’s rally. The OI (open interest) rates surged 3X, from about $50M to over $150M in just days. This suggested that leveraged players took massive debts to place bullish bets on BONK.
Market pundits expect the BONK rally to extend, partly due to the expected 1T token burn. However, the broader market sentiment could determine the next price direction for the memecoin.

Indicator: BUY BONK D1 at 0.00002104Indicator tells to buy BONKUSDT, D1 at 0.00002104, November 6, 2024
The price increased to 0.00005649$ and decreased to the current price of 0.00004961$. Currently, the indicator has not signaled to close (take profit) the BONKUSDT buy order.
Try indicator:

#BONKUSDT ( prision break ?? )The previous exit from the green pattern was a beautiful 250% Dash growth.
This time, it seems that he wants to come out of the cage in the form of a blue pattern
We will be aware of this in the coming minutes and hours
So WAIT and WATCH

BONKUSDTmy entry on this trade idea is taken from a point of interest BELOW an inducement.. I extended my stoploss area to cover for the whole swing as price can target the liquidity there before going as i anticipate.. just a trade idea, not financial advise

Here I buy BONK at $0.00005Buying BONK at $0.00005 right now in REAL TIME.
And Bonk supply shock is happening here right now.
You know, Doge supply shock happened at $0.25
Pepe supply shock happened at $0.000018
And now BONK supply shock is set.
And the countdown has just begun
I'm also very interested in memecoins, hence, the market will also be interested in meme coins
The skill to time them one by one and profit from compounding
You have really many things to learn from me. But now I have no time to teach you anymore. The clock is ticking since 6th
For now you can feel privileged by seeing the big things happening before your eyes

BOMEUSDTmy entry on this trade idea is taken from a point of interest BELOW an inducement.. I extended my stoploss area to cover for the whole swing as price can target the liquidity there before going as i anticipate.. just a trade idea, not financial advise

BONKUSDTmy entry on this trade idea is taken from a point of interest BELOW an inducement.. I extended my stoploss area to cover for the whole swing as price can target the liquidity there before going as i anticipate.. just a trade idea, not financial advise

#BONK #USDT Short Set UpHuge Bearish divergence on 1H TF. Shorted it at 0.00003799
Entry - 0.00003799
Stoploss - 0.00004422
TP-1-0.00003182
TP-2- 0.00002549

BONK Uptrend
Price is finishing blue wave 3 of an upside movement. Price is currently very overbought, so I don't consider this a good level for long trades.
I'll wait for wave 4 correction. A test of green support would be ideal to look for long trade opportunities.

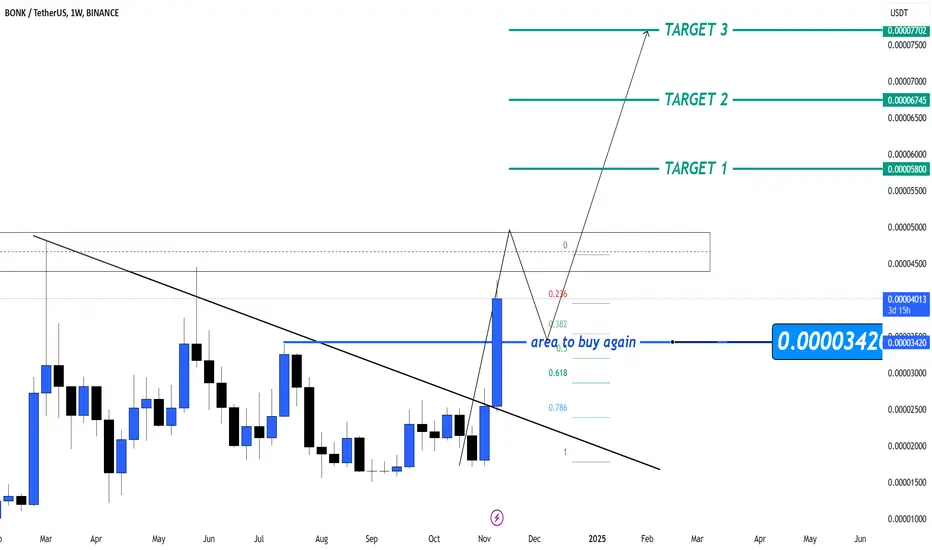
$BONK/USDT Analysise $BONK/USDT Analysise 📈🚀
The breakout from the downtrend line is a bullish signal, and the identified "buy again" zone offers a potential area to accumulate if the price retraces. If #BONK holds above the buy zone and gains momentum, it could reach the projected targets.
Target 1: 0.00005800 USDT
Target 2: 0.00006745 USDT
Target 3: 0.00007702 USDT
BONKUSDT Ready for Big PUMP!!!BINANCE:BONKUSDT has recently broken out and successfully retested a previous resistance level, showing signs of strength. Now, it’s attempting to break out of a triangle pattern, with the resistance line acting as a key barrier. If it manages to break through, a significant upward move could be on the horizon, fueled by the ongoing memecoin craze. However, caution is advised—consider using only a small portion of your capital to manage risk in this volatile environment.
BINANCE:1000BONKUSDT.P Currently trading at $0.000036
Buy level: Above $0.000033
Stop loss: Below $0.0000262
Max Leverage 3x
Always keep Stop loss
Follow Our Tradingview Account for More Technical Analysis Updates, | Like, Share and Comment Your thoughts

BONK USDT PERPETUAL Kindly wait for 8:30AM EST CPI Report
- Bearish Divergence
- Low Buying Volume (Potential Short)
- Trendline Support Breakdown

BONKUSDT (BONK) Updated till 12-11-24BONKUSDT (BONK) Daily timeframe range. we can see a nice continuous move here. not very far from its price discovery. at this volume a clean close above 0.00003289 can push it to 0.00004151 or above. recent retrace point at 0.00002441.
