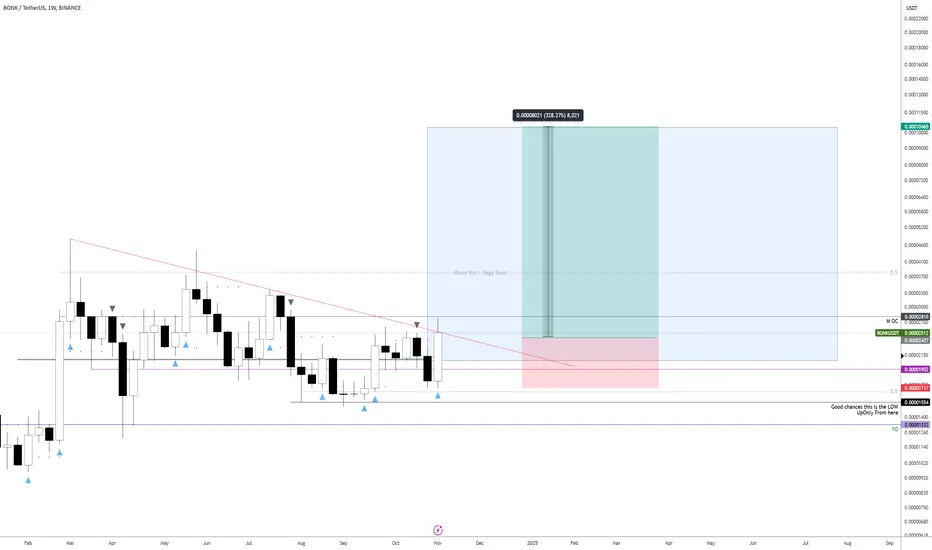
Massive Monthly Signal on $BONK: Clear Path Ahead!We’ve got a strong monthly signal on $BONK. While it doesn’t have the same extended targets as other coins, the direction is crystal clear!
An entry around 0.000022 would be optimal. Anything lower than that would be a gift.
I’ll be scaling back in after exiting the previous trade on the daily chart (it wasn’t ready to expand then). Now, with the macro signal in place, the outlook looks much stronger.
Targeting above 0.0001.
BONKUST trade ideas
How could we not lose this long position?We missed his entry point, but he had very good points😉
Pay attention, when the price was lowered, the volume decreased and when the price increased, the volume increased
It has had 4 collisions, after each collision that level weakens, with a weak reaction, before breaking the trend line, pay attention to how many base candles we put
You can also see the weakness of the sellers in the 4-hour time frame. You can see that the volume decreased when the price fell.
When you understand that the purchasing power is stronger, you can enter the strategy you have
As for now, I will wait for the market to make a structure🧐
If you want me to analyze a coin, tell me in the comment🫡
⚠️ Do capital management to survive ⚠️

BONK: A massive move could be around the corner! If you're looking to trade BONK at the moment, here's a quick setup that you might find helpful!
The idea is: Buy when the price breaks above $0.0000238 and take profits at the levels shown in the chart.
Targets:
1. $0.000025
2. $0.000027
3. $0.000029
-------------------------------------------
About our trades:
Our success rate is notably high, with 10 out of 11 posted trade setups achieving at least their first target upon a breakout price breach (The most on TW!). Our TradingView page serves as a testament to this claim, and we invite you to verify it!

#BONK Tapping Into Community-Driven Meme Coin PotentialDescription:
This trading idea focuses on BONK, a meme-based cryptocurrency that has captured attention due to its strong community support and decentralized ethos. Unlike many meme coins, BONK is positioned as a community-driven initiative, with a portion of its token supply distributed among various active participants to promote decentralized ownership and adoption. With its growing ecosystem, social traction, and community-driven efforts, BONK presents an intriguing opportunity for those looking to capitalize on the rise of community-led meme coins in the crypto market.
However, it's important to acknowledge that the market for meme coins like BONK is highly speculative and prone to extreme volatility. Rapid price changes, shifting market sentiment, and external factors such as media attention and social trends can greatly influence its value. This asset class carries high risk and should be approached with careful consideration.
Disclaimer:
This trading idea is for educational purposes only and is not intended as financial advice. Trading cryptocurrencies, including BONK, is speculative and carries a significant risk of loss. Investors should conduct their own due diligence, consider their financial position, and consult with a financial advisor before making any decisions. Past performance is not indicative of future results.

lets go for SUI memeBONK usdt pair
after a grow about 400% in SUI BONK can shot top of the memes.
we need a heavy candle for breaking red trendline. lets see what will happen

You don't want to miss this BONK rocketBONK/USDT is currently breaking out of triangle with potential 150% rise to price target 0,00005745.
Boost, follow.

Bonkusdt for buy.Price is bullish on the daily timeframe, price broke out of a resistance zone, retested it and gave multiple retest and long wick candle.

BONKUSDT - Climb Back to .00004The weekly MACD hasn't been drawn yet so there's likely more impact by the daily MACD on the price point.
BONK has seen .00004 as a high, so it's possible there's shorts waiting to get rekt at the top.
Expecting a slow climb back towards .00004.
Take note of the rising stochastic and MACD.
Long/shorts ratio has taken a standstill at .000012 to .000014 indicating there's a supply level there.
If it does fall to .000012 I would pick up more.
A great 2-3X hold.

BONKUSDT 3DBONK ~ 3D
#BONK Buy gradually inside this pattern,. Minimum target 20%++.
it is only a matter of time until this pattern is broken and the Bulls dominate.

Bonk next waveBonk looks ready to run
Indicators reset
Waiting on Mac’s to cross and watching for volume…. Incoming!!!
Target 2650

Bonk USDT - REALISTIC APPROACH BONK usdt pair shows slight movement. In 1 - 2 weeks time, it is most likely to test R1 and R2 in one month.
The RSI resistant line marked red. Sell it when it touches that point. HODL till it touches red line on RSI and then SELL no matter WHAT!

BONK: $0.000 00 14 | a Steve Jobs Moment meme is a way to expedite adoption
think DOGE where Elon peddled Tesla and now his SpaceX ipo and Open Ai
BONK is a means to awareness to rock the Mobile Phone space
maybe something to sexy is about to unfold approaching Dubai Blockchains this Feb Sep usual exercise

"Don’t Sleep on BONK: New Signals Pointing to a Trend Reversal!"Time to pay attention to BONK.
It has a 9-mode trend on the weekly and just fired a new signal on the daily. I was staying away from it since it was lacking momentum, but last week’s retest at 0.0000193 was enough to signal a trend continuation and that it was ready.
Easy 2x from here!
This one and CRYPTOCAP:DOGE seem poised to start making moves. Maybe higher-cap memes will trend soon.

BONK -50%Bonk is a very high volume coin with extreme risks to trade.
Many other coins favor a bigger drop in the analysis.
I analyze below the white line(0.000012) taking into account all other analysis which is total, btc and many other well known altcoins
I could be wrong as I always say, but I advise caution! MD

Bonk Catastrophe... Level 1 (50%), Level 2 (85%) & Level 3 (95%)I think a true disaster will happen here. It seems that the biggest damage will happen to the memecoins side of the market, based on what I am seeing coming from the charts.
Here we are looking at Bonk. You know, a major crash leads to a very strong rise when market conditions switch from bearish to bullish, we've seen this in the past. These memecoins grew really strong and the same also works in reverse. A major rise tend to produce a very strong correction and since there hasn't been much for this pair in comparison to recent growth, a major market flush can cause real damage.
Ok, what is the chart saying?
My name is Bonk, James Bonk...
➖ BONKUSDT can easily lose ~50%. This would be level 1.
But there is also level 2 and level 3.
➖ Level 2 would mean a 85% drop from current prices and level 3 a 95% drop.
➖ Level 1 support can be tested easily, that would be -50% for BONKUSDT. The other two, I don't know, but the market has been consolidation for many months for a major drop. If level 1 breaks, prepare for the worst.
Namaste.

Bonkusdt Trading opportunityBonkusdt is currently trading above a significant neckline, which is exhibiting robust support. Our expectation is a retracement towards this pivotal level before a resumption of bullish momentum, with a strong anticipation of impulsive wave 3 to ensue.
This wave 3 is subdividing into 5 sub-waves, as depicted on the chart. I believe this coin holds substantial potential.
A comprehensive follow-up will be provided for updates.
Share your insights in the comment section and show your support by liking the post.
Thank you.

bonkuusdtBONKUUSDT,shavyfxhub strategy which combines RSI divergence with daily candle rule and market structure ,the structure is playing on supply and i want a return into demand floor for further uptick.
based on the strategy we will advise that you allow price to area of value for trigger.
Transcript


#BONK/USDT#BONK
The price is moving in a descending channel on the 4-hour frame upwards and is expected to continue
We have a trend to stabilize above the moving average 100 again
We have an upward trend on the RSI indicator that supports the rise by breaking it upwards
We have a support area at the lower limit of the channel at a price of 0.00002000
Entry price 0.00002360
First target 0.00002614
Second target 0.00003149
Third target 0.00003507


BONK ANALYSIS📊 #BONK Analysis
✅There is a formation of Descending triangle pattern on daily chart with a good breakout and retest.🧐
Pattern signals potential bullish movement incoming after a breakout of major resistance zone
👀Current Price: $0.00002265
🚀 Target Price: $0.00003260
⚡️What to do ?
👀Keep an eye on #BONK price action and volume. We can trade according to the chart and make some profits⚡️⚡️
#BONK #Cryptocurrency #TechnicalAnalysis #DYOR

BONKUSDTBONK ~ 3D
#BONK Make purchases gradually in this pattern. It is only a matter of time until this pattern breaks out and the bulls return quickly

Bonk quick trade 15min chartBonk looks bullish
looks like cup & handle so kust wait for breakout and enter into a long trade
