Oil Prices Surge Amid Threat of Strike on IranOil Prices Surge Amid Threat of Strike on Iran
As shown on today’s XBR/USD chart, Brent crude oil prices have jumped (as indicated by the arrow) to a one-week high. This surge follows U.S. intelligence reports suggesting that Israel may be preparing to strike Iran’s nuclear facilities.
Although CNN, citing officials, noted that it remains unclear whether Israeli leaders have made a final decision, oil prices are rising as markets price in the risk of escalation disrupting Middle Eastern oil supply chains:
→ Iran is the third-largest oil producer within OPEC.
→ There is concern that Iran could retaliate by blocking the Strait of Hormuz in the Persian Gulf — a key shipping route used by Saudi Arabia, Kuwait, and others to export oil products.
Technical Analysis of XBR/USD
Brent crude oil price has climbed towards the descending trendline (marked in black), drawn through key highs from April and mid-May. From a bearish perspective, this key resistance could trigger a downward pullback.
On the other hand, recent price action in Brent suggests upward momentum (indicated by blue lines), with the $65.20 level — previously a cap — potentially turning into support after a breakout.
Whether the black resistance line is broken will largely depend on geopolitical developments. It is possible that reports of an imminent missile strike on Iran may later be refuted.
This article represents the opinion of the Companies operating under the FXOpen brand only. It is not to be construed as an offer, solicitation, or recommendation with respect to products and services provided by the Companies operating under the FXOpen brand, nor is it to be considered financial advice.
BRENT trade ideas

Brent Oil Update 23-May-25Disclaimer: easyMarkets Account on TradingView allows you to combine easyMarkets industry leading conditions, regulated trading and tight fixed spreads with TradingView's powerful social network for traders, advanced charting and analytics. Access no slippage on limit orders, tight fixed spreads, negative balance protection, no hidden fees or commission, and seamless integration.
Any opinions, news, research, analyses, prices, other information, or links to third-party sites contained on this website are provided on an "as-is" basis, are intended only to be informative, is not an advice nor a recommendation, nor research, or a record of our trading prices, or an offer of, or solicitation for a transaction in any financial instrument and thus should not be treated as such. The information provided does not involve any specific investment objectives, financial situation and needs of any specific person who may receive it. Please be aware, that past performance is not a reliable indicator of future performance and/or results. Past Performance or Forward-looking scenarios based upon the reasonable beliefs of the third-party provider are not a guarantee of future performance. Actual results may differ materially from those anticipated in forward-looking or past performance statements. easyMarkets makes no representation or warranty and assumes no liability as to the accuracy or completeness of the information provided, nor any loss arising from any investment based on a recommendation, forecast or any information supplied by any third-party.

Brent Crude Breaks Lower: Iran Deal Could Add 800K BarrelsBrent crude has dropped over 2% following news that the US and Iran may strike a deal, potentially adding 800,000 barrels per day to global supply. We explore the technical setup, including a wedge pattern and the risk of a deeper fall.
This content is not directed to residents of the EU or UK. Any opinions, news, research, analyses, prices or other information contained on this website is provided as general market commentary and does not constitute investment advice. ThinkMarkets will not accept liability for any loss or damage including, without limitation, to any loss of profit which may arise directly or indirectly from use of or reliance on such information.

BCOUSD | Bearish Rectangle PatternBCOUSD is following the bearish continuation since it has clearly printed a bearish rectangle pattern.Moreover there is no divergence on RSI which further strengthen our analysis.
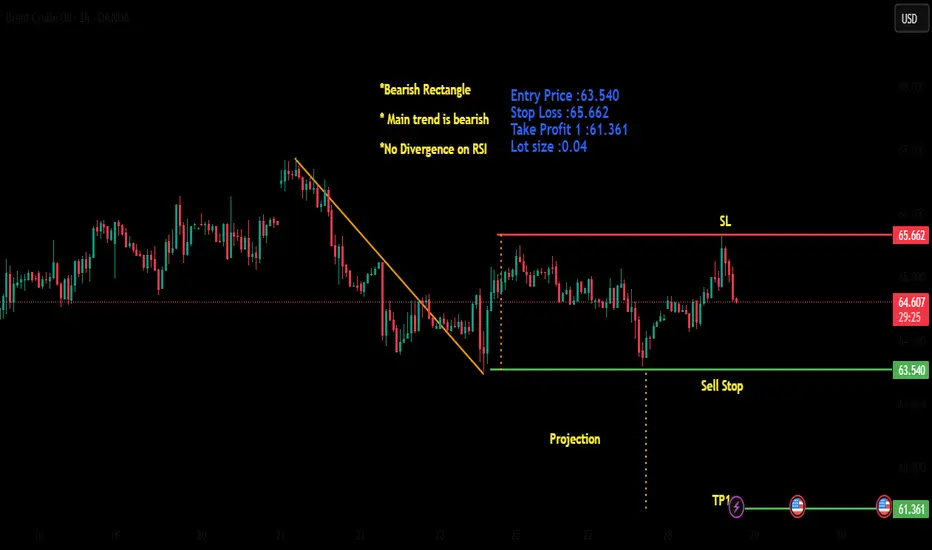
XBRUSD is moving within the 63.08 - 64.60 range👀 Possible scenario:
Crude oil prices held steady on May 28 amid OPEC+ talks and the loss of Chevron’s Venezuelan exports. Brent was $64.20/barrel, WTI $60.94. The U.S. barred Chevron from exporting Venezuelan oil, raising supply concerns and boosting reliance on Middle Eastern crude.
OPEC+ meets May 28, with a possible July output hike May 31. The U.S. remained a net energy exporter in February, with exports down 5% and imports down 6%, per EIA data. U.S. crude inventories likely rose 2.4 million barrels last week. Gasoline stocks fell 0.5 million barrels; distillate and jet fuel stocks increased. The EIA report is due May 28.
✅Support and Resistance Levels
Now, the support level is located at 63.08.
Resistance levels are now located at 64.60 and 65.75 .
Brent Crude Oil INTRADAY resistance at 6700Trend: Overall bearish sentiment continues, in line with the dominant downtrend.
Recent Price Action: The market is in a sideways consolidation, signaling indecision after recent declines.
Key Levels
Resistance:
6700 – Main resistance and pivot level.
Above that: 6860, then 7000 – Upside targets if bullish breakout occurs.
Support:
6350 – Initial downside target.
Below that: 6180, then 6080 – Further supports on continued weakness.
Trading Scenarios
Bearish Continuation:
A failed rally near 6700 followed by rejection could lead to a move toward 6350, 6180, and 6080.
Bullish Reversal:
A daily close above 6700 would break the bearish structure, targeting 6860 and potentially 7000.
Conclusion
Brent Crude remains bearish but is currently consolidating. A rejection at 6700 supports further downside. A breakout above that level would shift sentiment to bullish. Watch 6700 as the key decision point.
This communication is for informational purposes only and should not be viewed as any form of recommendation as to a particular course of action or as investment advice. It is not intended as an offer or solicitation for the purchase or sale of any financial instrument or as an official confirmation of any transaction. Opinions, estimates and assumptions expressed herein are made as of the date of this communication and are subject to change without notice. This communication has been prepared based upon information, including market prices, data and other information, believed to be reliable; however, Trade Nation does not warrant its completeness or accuracy. All market prices and market data contained in or attached to this communication are indicative and subject to change without notice.

BRENT outlook: Watching for a move toward the upper boundary (D)Price is currently trading within a broad range, and the main expectation is a move toward the upper boundary — but confirmation is key.
I'm watching the high of the May 22 bar as a key level, since it holds the highest traded volume in recent days.
If price breaks and holds above 64.987 ,
🎯 First target: 67.791
🎯 Second target: 68.619

Dive into the oil storm of 2025!In 2025, oil prices declined due to rising output from OPEC+ countries, growing inventories in the U.S., weakening global demand, a stronger dollar, and ongoing trade tensions between major economies. Further pressure came from OPEC+’s plan to boost production by 411,000 barrels per day — three times more than previously scheduled. A final decision is expected at the May 31 meeting. This move aims to strengthen the Alliance’s market position, particularly against U.S. shale producers, but it has deepened the supply-demand imbalance, pushing prices to their lowest levels in four years .
Despite current challenges, several factors could support a recovery in oil prices :
1. Rising demand in emerging markets : Developing economies are expected to continue increasing energy consumption as they grow, boosting oil demand.
2. Limited investment in production : Lower investment in exploration and drilling — especially in a low-price environment — may lead to tighter future supply, which can support prices.
3. Geopolitical risks : Conflicts and instability in oil-producing regions can disrupt supply chains, traditionally driving prices higher.
4. Slower non-OPEC+ output growth : While non-OPEC+ production is expected to rise in 2025, the U.S. Energy Information Administration forecasts slower growth in 2026, easing pressure on prices.
5. Possible OPEC+ output cuts : If the current production increase fails to deliver the desired results, OPEC+ may reverse course and reduce output to stabilize the market.
In 2025, the oil market is under strain due to surging OPEC+ output, inventory surpluses, weak global demand, and economic uncertainty. Yet, despite prices plunging to four-year lows, there’s still room for recovery. Future price trends will hinge on OPEC+ decisions, emerging market demand, geopolitical events, and investment patterns in the energy sector. The upcoming OPEC+ meeting could be a turning point for the entire market.

XBRUSD is moving within the 63.20 - 65.75 range👉🏼 Possible scenario:
Oil prices climbed on May 26 after President Trump extended the EU trade deal deadline to July 9, easing concerns over potential U.S. tariffs.
Brent and WTI rose on May 23 as stalled U.S.-Iran nuclear talks dimmed hopes for increased Iranian oil supply, while U.S. buyers covered positions ahead of the Memorial Day weekend. However, gains were limited by expectations that OPEC+ could raise output in July. With the U.S. Memorial Day holiday slowing trading, markets remain sensitive to trade developments and potential supply changes. With holiday-thinned trading, markets remain focused on trade headlines and supply signals.
✅ Support and Resistance Levels
Now, the support level is located at 63.20.
Resistance level is now located at 66.30 .

Brent Crude Oil Weekly Short Trade SetupBrent Crude Oil Weekly Short Trade Setup (as of May 22, 2025)
This chart reflects a prolonged downtrend within a clearly defined descending channel. Brent Crude Oil continues to respect the dynamic resistance of the upper boundary and has failed to sustain bullish momentum in recent months. The current price action presents a low-risk, high-reward short opportunity based on technical structure and projected price movement.
Entry Price: 64.994
The entry level at 64.994 is tactically chosen near the midpoint of the descending channel and slightly below the recent consolidation area. This level marks a rejection zone where price previously attempted to break higher but failed to gain traction.
The reason for this entry is:
• Price is reacting to the 20-period moving average (blue line), which has consistently acted as dynamic resistance.
• The last bullish push failed to close above the mid-channel zone and reversed near the projected retest line, indicating sellers are still in control.
• Entering here means you're entering after confirmation of a failed breakout rather than preemptively.
This is a conservative but smart entry point, favoring a continuation move in the direction of the dominant trend.
Stop Loss: 68.867
The stop loss is placed at 68.867, which aligns with the chart’s "Conservative Projected Retest Price Level" marked in green.
Here’s why this stop makes technical sense:
• This area corresponds to prior horizontal resistance and is very close to the descending channel’s upper boundary.
• A move above this zone would invalidate the bearish structure, suggesting a potential shift in momentum.
• Setting the stop here protects the trade against a deeper bullish retracement while still giving it enough room to breathe around minor fluctuations.
The risk is controlled, and you're only exiting if the market structure genuinely breaks.
Take Profit: 56.850
The take profit level is projected at 56.850, slightly above the "Weak Support Zone" marked in red.
The reasoning:
• This zone has acted as prior psychological support, but the label “weak” implies limited buyer strength here, increasing the chance of a breakdown.
• Price has tested this level before and rebounded only modestly, suggesting vulnerability.
• It also aligns closely with the lower boundary of the descending channel, which provides technical confluence as a realistic downside target.
• Setting TP just above support allows for safer profit booking without being too greedy, avoiding the risk of reversal right at a major support.
This exit point balances profit potential and probability, giving the trade a favorable risk-to-reward ratio.
Trade Structure Summary
• Trend: Bearish (confirmed by lower highs/lower lows and downward-sloping channel)
• Technical Confluence: Dynamic resistance, channel boundaries, horizontal zones, moving average rejection
• Market Sentiment: Weak upside follow-through despite occasional rallies, suggesting bearish control
Risk-Reward Outlook
• Entry: 64.994
• Stop Loss: 68.867
• Take Profit: 56.850
• Risk (SL - Entry): 3.873
• Reward (Entry - TP): 8.144
• Risk-Reward Ratio: Approximately 1:2.1
This setup offers more than twice the reward for the risk taken, making it an attractive candidate for traders seeking asymmetrical returns.

Brent Crude OilBrent crude oil prices might see a rise from the golden crab level 🦀📈
Could this be the start of an upward trend?

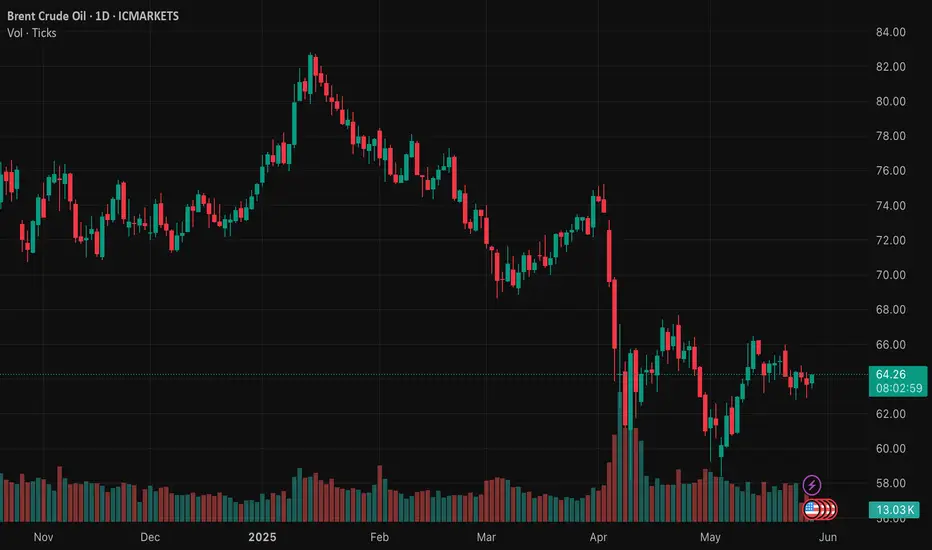
Brent crude oil Wave Analysis – 21 May 2025
- Brent crude oil reversed from key resistance level 66.00
- Likely to fall to support level 62.00
Brent crude oil recently reversed down from the key resistance level 66.00, which has been reversing the price from the start of April, as can be seen from the daily Brent crude oil chart below.
The downward reversal from the resistance level 66.00 created the daily Japanese candlesticks reversal pattern Evening Star.
Given the clear daily downtrend, Brent crude oil can be expected to fall to the next support level 62.00.

Oil Trade Setup: Watching the Breakout LevelsI believe it's still too early to short or go long on oil. The market is opening with gaps, and we need to wait for the chart to settle down before making any decisions.
Overall, the situation hasn’t changed much. It still looks bearish. The general trend is downward, and the price continues to stay below its 50-day moving average. Unfortunately, the setup for entering a short position hasn't materialized yet either.
📝Trading plan:
1. A breakout above 67.76 (the high of the April 23rd candle) would make a long position relevant. But that would require the asset to gain about 4.7%.
2. A breakdown below 63.3 would signal a short. That’s a -2.5% move.
It all feels a bit forced right now.
For the time being, I’m staying on the sidelines and just observing. But knowing how volatile this asset is and how quickly it can start moving, I’m not shelving the plan too far away.

Brent Crude U Turn from 64 level Brent crude took u turn from 64 level, all the way to 66 plus. Positional target is 7
75. Analysis was shared on last day .

XBRUSD Brent Oil Loot: Ride the Bullish Breakout Wave!🌎 Yo, Treasure Hunters! Aloha! Hola! Grüß dich! 🌟
Profit Plunderers, ready to strike? 🤑💸⚡
Forged with 🔥Outlaw Oracle tactics🔥 (technical + fundamental), here’s our slick plot to loot the "XBRUSD / Brent Oil" Energy Market. Stick to the chart’s path for a long entry, eyeing an exit near the risky YELLOW MA Zone. Beware—overbought vibes, consolidation, or a trend switch could snare you where bearish rogues prowl! 🏴☠️💰 "Grab your gains and party, traders—you’ve nailed it! 🎉💪"
Entry 📈: "The safe’s cracking! Watch for the MA breakout (67.50), then pounce—bullish bounty awaits!"
Hot tip: Place buy stop orders above the Moving Average or set buy limit orders at the recent 15/30-min swing low/high for pullback plays.
📢 Pop an "alert" on your chart to seize the breakout!
Stop Loss 🛑: "📣 Oi, listen up! 🗣️ If you’re jumping in with buy stop orders, don’t set that stop loss ‘til the breakout ignites 🚀. Follow my pin 📍 or take a wild shot 😜—but don’t cry if it backfires! ⚠️"
📍 Outlaw SL parked at the recent 3H swing low (63.00) for swing trades.
📍 Tweak SL based on your risk, lot size, and order stack.
Target 🎯: 72.50 or slip out before the goalpost.
🧲 Scalpers, heads up 👀: Play long-side scalps only. Deep pockets can dive in; smaller crews, tag along with swing traders for the heist. Use trailing SL to guard your stash 💰.
💸 UK Oil Spot / Brent Swing Trade Plot: Bullish fever 🐂 is roaring, sparked by key forces. ☝
📰 Dig In: Scope out Fundamentals, Macro Signals, COT Reports, Seasonal Trends, Intermarket Clues, Inventory Stats, and Future Targets 👉🔗
⚠️ Trading Alert: News & Position Savvy 🗞️ 🚨
News bombs can rattle prices and volatility. To lock in your loot:
- Dodge new trades during news drops.
- Slide trailing stops to pocket profits.
💖 Power our raid! 💥Smash the Boost Button💥 to supercharge our profit grab. Roll with the Outlaw Trading Posse, raking in wins daily with swagger! 🏆🤝🎉
Catch you at the next heist—stay locked in! 🤑🐱👤🚀
---
### Real-Time Data (UTC+1, May 14, 2025) 📊
**Brent Oil (XBRUSD)**:
- **Price**: ~$67.20 (based on latest market feeds).
- **MA Breakout Level**: ~$67.50 (as per strategy).
- **Stop Loss Level**: ~$63.00 (3H swing low).
- **Target**: $72.50.
- **Market Sentiment**: Bullish 🐂, fueled by shrinking inventories and geopolitical noise.
**Latest COT Data (Friday, May 9, 2025)**:
- **Commercial Hedgers**: Net long positions rose 4% in Brent futures, backing bullish momentum.
- **Large Speculators**: Net long but scaling back slightly, wary of overbought signals.
- **Data Source**: CFTC Commitment of Traders report.
**Key Fundamental Drivers**:
- **Inventory**: ICE Brent data shows -1.8M barrel draw last week, bolstering prices.
- **Geopolitical**: Ongoing Middle East supply risks keep markets edgy.
- **Seasonal**: Rising summer demand forecasts add tailwinds.
🔔 **Note**: Watch for API inventory data (late May 14, 2025) and OPEC updates for potential volatility.
---
💥 Hit that Boost and let’s ransack the Brent market together! 🚀
💖 Fuel our heist! 💥Tap the Boost Button💥 to power up our profit raid. Join the Bandit Trading Crew, snatching wins daily with ease! 🏆🤝🎉 Stay sharp for the next caper—see you soon! 🤑🐱👤🚀

BCOUSD | Bullish TrendBrent crude oil is in very good bullish trend while making new higher highs and higher lows.

Crude Oil: Waiting for Clear SetupThe upside movement in oil is very limited, and the overall trend remains bearish.
I'm not considering long positions at this point. For a trend reversal, I would need to see a breakout above 68 — ideally with some consolidation above that level. Too many “ifs” right now. For me, there’s no clear trade setup here yet.
As for short positions, it’s still too early. I’d like to see a daily close below 63.50 before considering an entry.

Crude is all set for $70 rally.The 1 hour candle looks closing above the 21 EMA, which will make the crude to take a u turn from this level to $70 positionally.

UKOIL 0.618 Retracement BullishUKOIL has hit the 0.618 retracement area. Might be bullish, also have high level of negativity in oil market calling for $40 oil. Narrative may turn.

UPDATE - Brent Crude missed Take profit - Time to panic?Well with trading it's never time to panic.
If you're panicking it means:
1. Your ego is too high and you're predicting rather than reacting
2. Risking too much
3. Attaching emotions to machine
Even if it hits the stop, that's the name of the game - TRADING>
However, the game is still in play. The price continues to make lower highs and it looks up it's going up to test the recent downward trend line.
Break above, and it will be more likely to not play out.
But NO panic! Please we're adults and taking on this as a business venture not a lotto.
M Formation
Price<20 and 200
Target $56.13
Disclosure: I am part of Trade Nation's Influencer program and receive a monthly fee for using their TradingView charts in my analysis.

I expect a return in oil prices from these levels to the upside.I expect a return in oil prices from these levels to the upside

Bearish Look for potential Reversal bearish candlestick Patterns formation upon the retest of daily supply zone.

XBRUSD is moving within the 58.80 - 62.80 range👀 Possible scenario:
Oil prices rose nearly 1% on May 8, lifted by optimism ahead of U.S.-China trade talks scheduled for May 10 in Switzerland, where Treasury Secretary Scott Bessent will meet with China's top economic official to address trade tensions. The potential easing of the dispute between the world’s largest oil consumers could support demand. However, gains were capped by concerns over inflation and unemployment after the Fed kept interest rates unchanged.
U.S. crude inventories fell by 2 million barrels, and production slightly declined, offering additional price support. Still, Citi Research lowered its 3-month Brent forecast to $55, citing ongoing supply risks and uncertainty around a possible U.S.-Iran nuclear deal.
✅ Support and Resistance Levels
Now, the support level is located at 58.80.
Resistance level is now located at 62.80 .
