Brent Outlook: Key Levels for Downside or Bullish ReversalHello,
BLACKBULL:BRENT is likely to face more downside if the 1D PP acts as resistance again. In that case, the price may revisit previous lows at 70.754 and 68.675. A break and sustained move below these levels will confirm further downside. However, a break and hold above the 1M PP could signal a bullish reversal and open the door to further upside.
No Nonsense. Just Really Good Market Insights. Leave a Boost
TradeWithTheTrend3344
BRENT trade ideas

Brent: descending triangle signals potential 8.47% slideBrent crude oil prices are stuck in a large descending triangle, with a breach to $70.31, the lows from October and September, suggesting a decline to $64.27 per barrel, representing a potential slide of 8.47%. However, if the price breaks above the trendline side of the pattern and surpasses the November 25 high of $74.83, it could rise to $79.91.
This content is not directed to residents of the EU or UK. Any opinions, news, research, analyses, prices or other information contained on this website is provided as general market commentary and does not constitute investment advice. ThinkMarkets will not accept liability for any loss or damage including, without limitation, to any loss of profit which may arise directly or indirectly from use of or reliance on such information.

UKOIL - long
weekly candle okay. still below 20 and PP but we have had strong PA as price got absorbed around POC and closed with high vol and delta.
orgin - looking for buyers to step in as price pulls back to VA. I could short it at the open with SL over POC close (needs to close above POC) thereby fading the long move. we'll see on LTF

Brent Crude Oil Consolidates Ahead of OPEC+ MeetingBrent Crude Oil Consolidates Ahead of OPEC+ Meeting
The ATR indicator on the XBR/USD chart has dropped to its lowest level since early autumn, signalling reduced volatility. This likely reflects market participants awaiting announcements from the OPEC+ meeting scheduled for 1 December.
Overall, Brent crude prices remain under pressure due to:
→ reduced tensions in the Middle East, with reports this week confirming a ceasefire agreement between Israel and the Lebanese militant group Hezbollah;
→ news of rising crude oil inventories in the U.S.;
→ forecasts of slower oil demand growth from China in 2025.
On the other hand, the $70-71 range serves as strong support, marked by key lows from 2023-2024.
From a technical analysis perspective, the fluctuations in XBR/USD oil prices are forming a pattern resembling Andrew’s Pitchfork, although it is not an exact match.
Key observations:
→ The central line has shifted from support to resistance, as indicated by the arrows.
→ The lower line is preventing the price from breaking the year's lows.
If the OPEC+ meeting brings no surprises, the period of reduced volatility may persist, with Brent crude prices fluctuating within this range.
This article represents the opinion of the Companies operating under the FXOpen brand only. It is not to be construed as an offer, solicitation, or recommendation with respect to products and services provided by the Companies operating under the FXOpen brand, nor is it to be considered financial advice.

BRENT - UniverseMetta - Signal#BRENT - UniverseMetta - Signal
H4 - A triangle may form in continuation of the downward movement within the channel. It is better not to increase the risks. Stop behind the maximum.
Entry: 72.215
TP: 71.781- 71.209 - 70.726 - 69.917
Stop: 73.062

OIL_BRENTBrent Oil #OIL_BRENT - We expect the formation of a harmonic pattern with a minimum target at 68 and a maximum at 59. It is likely that the price will settle at the minimum target of 68.

Brent - oil waiting for regional stability!Brent oil is below the EMA200 and EMA50 in the 4H timeframe and is moving in its upward channel. At the bottom of the rising channel, we will look for positions to buy oil. In case of a valid failure of this channel, we can witness the continuation of the downward trend.
U.S. President Joe Biden announced that Israel and Lebanon have agreed to a ceasefire. He expressed gratitude to French President Emmanuel Macron and emphasized that Israel did not initiate this war, nor were the Lebanese people seeking conflict. Biden stated that Israel has destroyed Hezbollah’s infrastructure in southern Lebanon but stressed that lasting security cannot be achieved solely on the battlefield. The ceasefire is set to take effect at 4 a.m. local time tomorrow, aiming for a permanent end to hostilities.
Meanwhile, Goldman Sachs predicted that Brent crude oil prices face short-term risks that could push them to around $80 per barrel in the first half of 2025, assuming Iranian oil supply drops by 1 million barrels per day due to stricter sanctions. In contrast, the bank expects medium-term risks to Brent prices to tilt downward due to high spare capacity in the market. Goldman Sachs also estimated that Brent crude prices could fall below $60 per barrel in 2026 if a 10% tariff is imposed or OPEC increases its supply in 2025.
Separately, Bloomberg reported that China’s small and private refineries are paying higher prices for Iranian oil due to reduced shipments and fewer offers. These refineries have been purchasing light Iranian crude for December delivery at smaller discounts compared to ICE Brent benchmarks. Limited shipping availability and delays have constrained Iran’s oil exports to China.
Russian Deputy Prime Minister Alexander Novak, during a meeting with OPEC’s Secretary-General, stated that Russia intends to strengthen its cooperation with OPEC. Novak highlighted that the energy market remains under significant pressure, with price volatility being one of the key challenges. He stressed the importance of closer collaboration between Russia and OPEC to address these issues, asserting that joint efforts can contribute to greater stability in the energy market. Novak also revealed that Russia is preparing to lift its gasoline export ban, with the necessary documentation expected to be finalized soon, although no exact timeline was provided. He pointed to the market’s balance achieved through OPEC+ actions and quota implementation, emphasizing the importance of continued measures to ensure stability.
According to the latest JODI data, Saudi Arabia’s crude oil exports increased by 80,000 barrels per day in September, reaching 5.75 million barrels per day, the highest level in three months. This rise in exports likely resulted from reduced direct crude oil consumption for power generation as the country’s hottest months came to an end. JODI data showed that direct crude burning fell by 296,000 barrels per day in September, reaching approximately 518,000 barrels per day.
Saudi Arabia, the world’s largest crude oil exporter, saw a slight decrease in oil production in September, down by 17,000 barrels per day to 8.98 million barrels per day. Refinery throughput in the country reached 2.756 million barrels per day in September, the highest in four months and 35,000 barrels per day higher than in August.
This production level aligns with Saudi Arabia’s summer commitment to maintain output at “around 9 million barrels per day,” consistent with OPEC+ cuts and a voluntary reduction of 1 million barrels per day.
Saudi Arabia and its OPEC+ partners have postponed their planned production increases from December 2024 to January 2025. The group now plans to begin increasing supply in January, initially by 180,000 barrels per day for the first month.
Saudi Arabia is expected to deliver less crude oil to China, the world’s largest oil importer, in December. Trade sources told Reuters last week that weak demand in China has prompted Saudi Arabia to reduce its shipments to the country.

With OPEC+ meeting on Sunday, where to next for crude?Despite the crosscurrents of tariffs, ceasefire agreements and an impending OPEC+ meeting, a certain calm descends over the crude markets and stability is the order of play. The Brent futures price looks quietly content in a $75 to $71 range, and I see these levels as defining the near-term directional risk - where a breakout of either level would offer some degree of confidence of price kicking on further from that point. For now, the crude market has found a fair value, and the aggregation of all flows and positioning seems happy with pricing with the collective waiting for new news to present itself which could lead to a new trend or higher volatility.
We’ve seen limited interest in moving either WTI or Brent futures positioning around the post-ceasefire agreement and tariff news, and both factors are now largely in the price. Subsequently, energy traders will be looking more intently towards the weekend OPEC+ meeting and starting to review scenarios and probabilities.
Of course, many of the big US-based oil traders will be taking an extended break for Thanksgiving. However, orders may need to be left with others on the desk as any pre-positioning ahead of the OPEC+ meeting will still need to be put in place before Friday's futures markets close, as the prospect of gapping risk in crude on the Monday open is still a risk that needs to be managed. That said, the calmness seen in the price action and lack of trending conditions suggests oil traders see the OPEC+ meeting as a lower volatility affair, with the group likely to swing to an almost unanimous call to hold off from unwinding its 2.2 mbd voluntary cuts until Q125 – with crude at $73 and the Trump/Bessent combo exploring another 3 mbpd of US output, this may be the prudent thing to do for now.

CRUDE OIL SELLLooking to sell Crude OIL around 72.2 targeting 71.47. Price is trading within a falling channel and should see another bearish leg into the support.

BRENT Faces Resistance at 1M PP, Downside LoomsHello,
BLACKBULL:BRENT has encountered resistance once again at the 1M pivot point (PP) and is now moving to test the 1W PP. Previous low points at 68.675 and 70.720 have historically provided support, but further downside appears likely unless the price can establish strong support above the 1M PP in the future. In recent weeks, there were attempts to shift toward a more bullish outlook, but these efforts have been partially thwarted by the 1M PP acting as a persistent barrier. Patience is key, as upside potential remains on the horizon!
No Nonsense. Just Really Good Market Insights. Leave a Boost
TradeWithTheTrend3344

UKOIL LONGSIn a support area in which I expect a push to the upside. Came close to previous week low and expect the next daily candle to close above that blue resistance with TP around 74.03

Double pullback on a double bottom patternWe have identified a double bottom pattern followed by a breakout. Currently, we are observing a double pullback, which presents an opportunity to enter a long position.
WE ONLY TRADE PULLBACKS


BRENT - UniverseMetta - Signal#BRENT - UniverseMetta - Signal
D1 - Formation of a triangular formation + fixation behind the trend line. Possible from the current ones. Stop behind the minimum.
Entry: 74.409
TP: 76.373 - 79.909 - 82.030 - 85.671
Stop: 70.929

OIL_BRENT 1H Reversal Points;
Brent is expected to form either a high or a low around the following dates.
How i/to use it correctly;
Identify the trend correctly before the reversal date.
Better if there is a good possibility of a high or low.
Wait for a reversal candle or rejection that is good enough.
Enter, putting your SL above or below the candle.
Double your SL.
When to get out is optional but do secure yourself.
Use the R System for Forex Trading.
This technique is still under development. I am not responsible for any outcomes or consequences that may arise from following these instructions. Proceed at your own discretion.

Double bottom patternWe have identified a double bottom pattern followed by a breakout. Currently, we are observing a pullback, which presents an opportunity to enter a long position.
WE ONLY TRADE PULLBACKS

UKOIL - Short SetupMy main trading principle is that the price always moves from swept liquidity levels to untouched liquidity levels.
In particular case we clearly can see the following context: price swept 1D key liquidity level and left untouched level lower.
But to take more statistically more probable trades we should wait for some time of lower timeframe confirmation. For me the best way to confirm higher timeframe context is structure.
We can notice the break of market structure (sign of weakness) on key liquidity level, so there is a higher probability to see price lower at least on opposite level (marked lower).
Your success is determined solely by your ability to consistently follow the same principles.

Brent - Oil waiting for a new war?!Brent oil is located between EMA200 and EMA50 in the 4H time frame and is moving in its upward channel. At the bottom of the rising channel, which is also at the intersection with the demand zone, we will look for oil buying positions. In case of a valid failure of the downward trend line, we can witness the continuation of this upward trend.
Senior Russian lawmakers have warned that Washington’s decision to allow Kyiv to launch deep strikes into Russia using American long-range missiles will escalate the conflict in Ukraine and could lead to World War III. Vladimir Dzhabarov, the first deputy chairman of the Russian upper house’s foreign affairs committee, stated that Moscow’s response would be immediate. Speaking to the state-run TASS news agency, he remarked, “This is a significant step toward the start of World War III.”
Russia’s Ministry of Defense confirmed that its missile defense systems had intercepted five out of six missiles fired. According to the RIA news agency, debris from one of the missiles, part of the U.S. Army’s ATACMS tactical missile system, landed near a military facility in the Bryansk region. Interfax news agency also reported that the attack on Bryansk was confirmed and attributed to Ukraine’s use of ATACMS missiles.
Russian Foreign Minister Sergey Lavrov described Ukraine’s strikes on Russia’s border regions using ATACMS missiles as a clear message of escalating tensions. He also noted that President Vladimir Putin had previously issued warnings about such actions.
Mike Waltz, a congressman from Florida, stated on November 18 that the Biden administration’s decision represents another step up the escalation ladder, with no clear end goal in sight. Meanwhile, Donald Trump Jr. warned on X that this move risks sparking “World War III,” echoing Kremlin warnings. Former President Trump has yet to outline a specific plan for ending the war, raising concerns that he might pressure Ukraine into accepting an unfavorable agreement with Russia.
In other developments, Francisco Blanch, a commodities strategist at Bank of America, noted that Trump’s pledge to impose hefty tariffs to boost U.S. manufacturing and create jobs could lower commodity prices. Speaking on Bloomberg TV, he remarked, “Trump’s priority is the U.S. economy.” Trump has proposed a 20% tariff on all foreign goods and a 60% tariff on Chinese imports. Experts warn that such a strategy could lead to inflationary pressures.
Meanwhile, the Biden administration has halted issuing LNG export licenses to countries without free trade agreements with the U.S., citing the need to study the environmental, economic, and national security impacts of such exports.
Additionally, a report reveals that BP’s ambitious efforts five years ago to transform from an oil company to a low-carbon energy business have been reversed. BP is now focusing on reclaiming its position as an oil and gas giant, addressing investor concerns over future profitability. Competitors like Shell and Equinor have similarly scaled back their green energy plans due to the energy shock from the Ukraine war and the declining profitability of renewable projects.
BP CEO Murray Auchincloss plans to invest billions in new oil and gas projects in the Gulf of Mexico and the Middle East while slowing down its low-carbon operations. The company has halted 18 initial hydrogen projects and announced plans to sell off wind and solar operations. Both BP and its competitors continue to invest in low-carbon energy but are focusing more on quickly profitable sectors like biofuels. Offshore wind and hydrogen projects that have already commenced will proceed, with additional investments considered only if competitive returns are assured.

Brent/UK Oil Spot Market Money Heist Plan on Bullish SideHallo! My Dear Robbers / Money Makers & Losers, 🤑 💰
This is our master plan to Heist Brent/UK Oil Spot Market Market based on Thief Trading style Technical Analysis.. kindly please follow the plan I have mentioned in the chart focus on Long entry. Our target is Red Zone that is High risk Dangerous level, market is overbought / Consolidation / Trend Reversal / Trap at the level Bearish Robbers / Traders gain the strength. Be safe and be careful and Be rich.
Entry 📈 : Can be taken Anywhere, What I suggest you to Place Buy Limit Orders in 15mins Timeframe Recent / Nearest Low Point take entry in pullback.
Stop Loss 🛑 : Recent Swing Low using 2H timeframe
Attention for Scalpers : Focus to scalp only on Long side, If you've got a lot of money you can get out right away otherwise you can join with a swing trade robbers and continue the heist plan, Use Trailing SL to protect our money 💰.
Warning : Fundamental Analysis news 📰 🗞️ comes against our robbery plan. our plan will be ruined smash the Stop Loss 🚫🚏. Don't Enter the market at the news update.
Loot and escape on the target 🎯 Swing Traders Plz Book the partial sum of money and wait for next breakout of dynamic level / Order block, Once it is cleared we can continue our heist plan to next new target.
💖Support our Robbery plan we can easily make money & take money 💰💵 Follow, Like & Share with your friends and Lovers. Make our Robbery Team Very Strong Join Ur hands with US. Loot Everything in this market everyday make money easily with Thief Trading Style.
Stay tuned with me and see you again with another Heist Plan..... 🫂

Bearish bias on Brent Crude oil [UK OIL]There's a Break of structure at 73.563 to the downside, Consolidation occurred and a liquidity sweep at 70.68 to the upside, the market eventually came back at that liquidity sweep at 70.68 and gained momentum to the upside The pullback that was formed indicates a liquidity sweep pullback I'm anticipating liquidity to be swept at 73.563 to rally to the 2h supply zone, my conjecture is continuation of sells from that 2h zone to 71.467 as my profit targets there's a 30m demand at 71.467 that I'll use as my profit target

Brent Crude Oil Analysis: Bulls Hold the Line at Key SupportBrent Crude Oil Analysis: Bulls Hold the Line at Key Support
The XBR/USD chart reveals that Brent crude oil is trading near its lowest levels of the year.
Several factors are pressuring oil prices:
→ China's uncertain demand outlook: As the world's largest crude oil importer, any signs of weakening demand weigh heavily on the market.
→ A strengthening US dollar: Since Brent is priced in USD, a stronger dollar makes oil more expensive for international buyers, dampening demand.
→ Trump's promises to halt wars, including in the Middle East: This reduces geopolitical risk, which traditionally acts as a bullish factor for oil prices.
Technical Analysis of XBR/USD
From a technical perspective, bears appear to maintain control as a key trendline has shifted from acting as support to resistance (as indicated by the arrows on the chart).
Currently, the price oscillates around this trendline, which serves as the median of a channel marked by blue boundaries:
→ The upper boundary has been tested only once.
→ The lower boundary is under consistent pressure. Bulls, however, have managed to keep the price above the psychological $70.00 level.
How long can demand forces sustain Brent above $70? A fresh bearish breakout below this level could occur, testing whether buyers can prevent the market from extending its downtrend, which has persisted since April 2024.
This article represents the opinion of the Companies operating under the FXOpen brand only. It is not to be construed as an offer, solicitation, or recommendation with respect to products and services provided by the Companies operating under the FXOpen brand, nor is it to be considered financial advice.

Bearish Bias on Brent Crude OilMarket structure is currently on a downtrend with healthy price action forming Lower lows and lower highs a break of a swing low at 73.34 occurred to the downside. Liquidity sweep occurred at 70.742 making the pullback or retracement a liquidity sweep pullback. My conjecture is equal highs being swept at 72.736 to rally towards the 2h supply zone I anticipate continuation of sells from 73.74 to 71.039 as my target

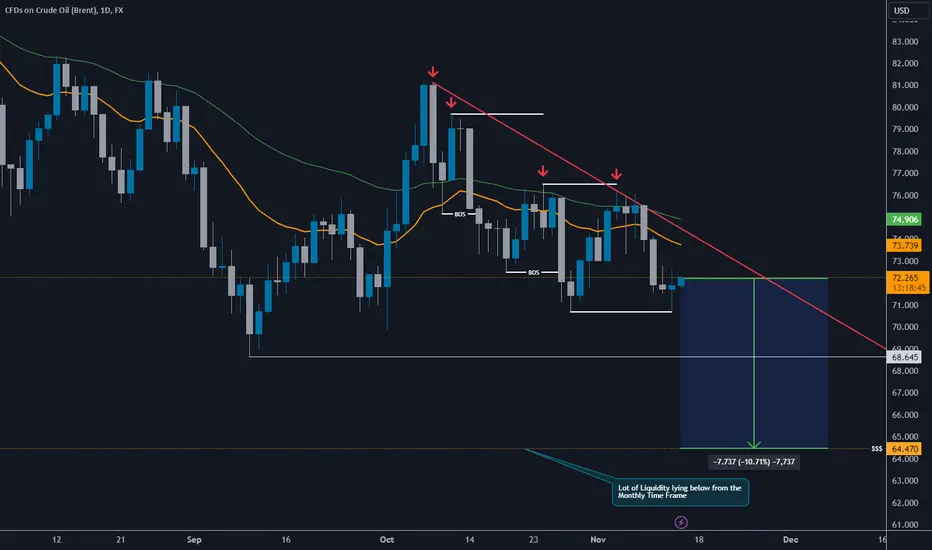
SHORT OIL (10% Profit from Current Prices)- BRENT started a Downward Trend since it Broke $75.13 creating lower highs and Lower lows
- Dollar is Clearly in an upward Trend
- Trumps policy is with increasing US Shale Oil production which is negative for price
- Monthly and Weekly Timeframes are all showing weakness
- Short at current Prices to Target liquidity around the $64.50