brett, BRETT could ride the wave to new highs. $0.30 is a realistic target if sentiment remains bullish and catalysts align
chat gpt
BRETTUSDT trade ideas

Brettusdt shortJust now opened a short position on brett. Following my DTT strategy. Direction is down. Target is $0.48 area
And in terms of timing should start breaking down any moment now...or perhaps consolidate a bit mroe until US session but looks likely to breakdown.
Time sensitive
Roughly 2 RR

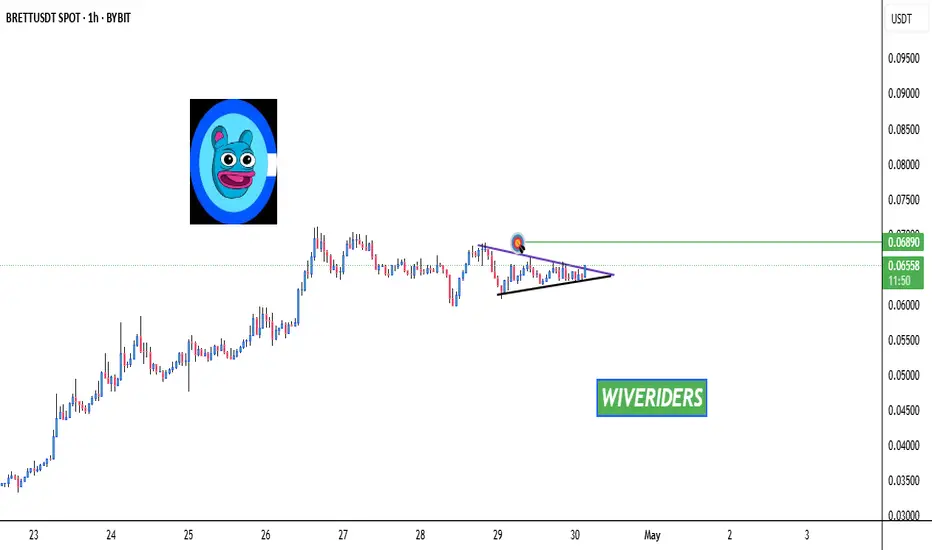
BRETT Forming Bullish Pattern🚨 $BRETT
Forming Bullish Pattern 🚨
$BRETT
is forming a bullish pattern. If the price breaks out above the current resistance level, the first target will be the green line level.
📈 Technical Overview:
Pattern: Bullish
Resistance Zone: Current level being tested.
🎯 Breakout Target: Green line level
BRETTUSDT CRYPTOBRETTUSDT
Crypto again show strength that's why I'm bullish in BRETTUSDT. It hold good strength to show us upward move. In Crypto, never trade in hurry and always add Qty in layers.
Think about it then make your trade according to your RISK.

Brett: Your Altcoin ChoiceA Solana memecoin, Brett produced a year long higher low with the classic ending diagonal pattern to signal an upcoming trend reversal.
The first low happened in April 2024. The second and higher low this month, this week, 7-April 2025.
The chart dynamics are very simple. Are you wondering, is the timing right? Right for a buy, maybe. Right to hold or, will a reversal happen soon?
The answer is positive to all those questions.
The time is right and is also ripe for a reversal to take place. This is the best possible time right now to buy and hold. The market must be bought when prices are low and red. This is the situation with the chart today. Prices are low and red but ready to turn. All the early signals are in.
BRETTUSDT is showing potential for a strong bullish wave in the coming months. Being new and also trading at bottom prices, growth can go off the chart. I will not be surprised when this pair goes beyond the 1,115% shown on the chart, this target is based on the mid-term.
The first target can reach 415%.
This is an easy chart. This is an easy trade.
I don't like memecoins, but it is not about what I like, it is about what the chart says.
The chart says that this pair is bullish with huge potential for growth. If you like it, feel free to enter with force. The Cryptocurrency market is turning bullish now and this and other pairs are sure to grow.
Thanks a lot for your continued support.
Your timing is great. A good Altcoin Choice.
Namaste.

I like BRETTUSDT in this price range! Bullish on BRETT / USDC on base - I like it at this $.04 cent range.
I Can see BRETT/ USDC on BASE pump through $0.50+
Can possibly see a pull back in to the $0.02 range, but long term there is a lot of room to the upside.

Brett long to $0.039Just recently opened a long position on brett. Anticipating a breakout to $0.039 soon. Overall market is pumping and it was left behind a bit weak but seeing some signs that bulls are coming in.
Could be delayed pump

BRETT Breakout Inverse H&S 0.049 Next- Downtrend Breakout
- Retest of the downtrend successful
- Weekly Support = red line
- Weekly Resistance = blue line
$0.049 Target $0.048 Next

Brett Weekly Chart - $0.049 Next (55%+)Red = Weekly Bottom
Blue = Proven support & Resistance lines
Currently there is a breakout and a W around the Red Bottom telling me the next move is up. Combined with an inverse head and shoulders with a 0.049 target

BRETT Crypto Trading Idea: Fundamental Edge & High-Risk Strategy🔍 Fundamental Concentrate:
BRETT (Brett) is a meme coin inspired by the iconic "Boy's Club" comic character, gaining traction in the crypto community.
Built on Base Chain, it leverages Ethereum’s scalability and low fees, attracting speculative traders.
Recent partnerships or exchange listings could drive volatility. Monitor social sentiment (Twitter, Telegram) for hype cycles.
Low liquidity vs. high volatility creates swing opportunities but requires tight risk management.
⚠️ Crypto Trading Disclaimer:
HIGH RISK: Meme coins like BRETT are extremely speculative. Only trade with capital you can afford to lose.
Past performance ≠ future results. Crypto markets are 24/7 and highly manipulated.
DYOR: This is not financial advice. Verify fundamentals, liquidity, and project updates independently.
Use stop-losses and avoid overleveraging.
📌 Final Note:
BRETT’s price action often mirrors meme coin trends (e.g., PEPE, DOGE). Watch for breakouts with volume and sudden sentiment shifts. Trade responsibly!

Brett short to $0.02762 and lowerJust not too long ago entered brett short.
Targeting $0.02762. I'll take 50% profit there then continue to hold the rest. I'll decide on remaining tp afterwards.
Time sensitive.

Brett long to $0.0407Just now opened a long position on Brett. Am expecting a breakout to the upside soon to continue the uptrend.


Brett to dump again down to $0.03761I just now opened a short on Brett. I anticipate the market will start to dump back down to $0.03761 area..starting about now leading into the morning.
Smart sellers should find this as an attractive price

BRETT/USDT- Breaks out of 3 month of trendline.
-Yesterday listed on Coinbase Futures.
Entry: 0.043-0.039
Target:100%-200%

BRETTit looks like the downtrend is ended and it will try to climb, as i have seen brett it has been listed on coinbase futures, lets see if it will get on spot trading in other exchanges.
nfa
dyor

LONG BRETTUSD Really like this chart.
Buying in the inception high low range reduces overall risk.
Can see BRETTUSD back in the $0.10 - 0.15 cent range.
No brainer. Long. Enjoy the Joy.

BRett scalp short to $0.03725I just recently now opened a scalp short on brett.
Aiming for 2RR.
Target: $0.03725


$BRETT - The Leading Memecoin on BaseBrett is the legendary character from Matt Furie’s Boys' club comic. He is a dancer and loves video games. Now he is living on the BASE blockchain as a Fan tribute. He has become blue mascot of the blue chain, BASE.

Brett is very bearish!I bought here some...Could Brett break this chanel from upside...What's your opinion?
Could price go more down? or maybe go higher?! BYBIT:BRETTUSDT

Weekly CLS, Key Level 50% Daily OB, Model 1Weekly CLS, Key Level 50% Daily OB, Model 1
you are welcome to comment with your thoughts and share your charts or questions below, I like any constructive discussion.
What is CLS?
This company is trading for the biggest investment banks and central banks. They trade over 6.5 trillion daily volume. They are smart money of the all markets.
CLS operates in the specific times which will give you huge advantage and precisions to you entries. Focus on that. Its accuracy is amazing.
Good luck and I hope this educational post helps to become better trader
“Adapt what is useful, reject what is useless, and add what is specifically your own.”
Dave FX Hunter ⚔

HolderStat | AI agents are your new profit 🤖 AI agents are artificial intelligence-driven programs that operate autonomously on the blockchain to analyze data and perform tasks.
Top AI agents:
1️⃣ VIRTUAL - a platform for developing and managing AI agents 🛠️
2️⃣ AI16Z - an AI-managed venture capital fund to which token holders can pitch projects for investment 💰
3️⃣ AIXBT - an agent that analyzes trends in crypto. Token holders can access the analytics platform, but beyond that, the AI agent runs the platform in X 📊
_____________________
👉 Want more posts? Like and subscribe to stay up to date!
Always DYOR! 🔬
