Brett Bounces of Support This weekly chart highlights Brett's textbook bounce from support , reinforcing my high conviction that Brett will perform well this bull cycle.
There are many reasons behind this bullish outlook. If you're interested in understanding meme coin trading strategies, take advantage of my free course—a limited-time offer!
What do you think about these levels? Are they aligning with your perspective?
BRETTUSDT trade ideas

$BRETT LONG FOR ALTSEASONCRYPTOCAP:ETH has been building up for a massive breakout once SIX:BTCD falls we will see CRYPTOCAP:ETH run towards 10k. The biggest memecoin on BASE Coinbases layer 2 is set to follow CRYPTOCAP:PEPE and CRYPTOCAP:ETH & outperform them both.

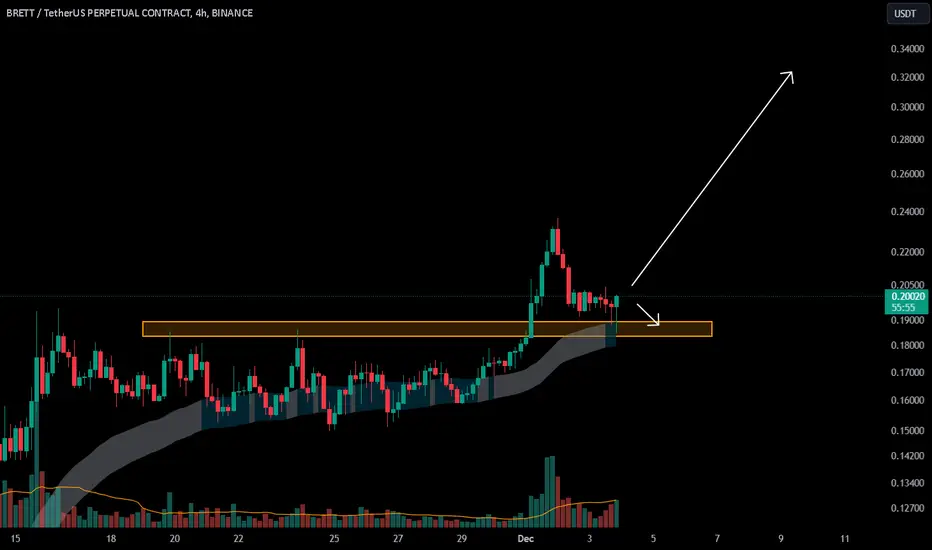
Best Level to BUY/HOLD BRETT 300% gains swing trade setup🔸Hello guys, today let's review 12hour price chart for BRETT. Strong sequence of higher lows in progress and well defined swings recently.
🔸Overall bullish outlook, however currently pullback in progress and it's recommended to stay out until the pullback is complete, based on measured move price is projected to hit 8/9c before reversal.
🔸Recommended strategy bulls: bullish structure in progress, however it's recommended to stay out and wait for a better re-entry price at/near 8/9 cents. final TP bulls is 34/36c 300%+ unleveraged upside. patience required, this is a swing trade setup. good luck!
🎁Please hit the like button and
🎁Leave a comment to support our team!
RISK DISCLAIMER:
Trading Futures , Forex, CFDs and Stocks involves a risk of loss.
Please consider carefully if such trading is appropriate for you.
Past performance is not indicative of future results.
Always limit your leverage and use tight stop loss.

If it can stay and bounce from support area it will be upIf it can stay and bounce from support area it will be going to cosmos.

HolderStat | The best meme from top 100🔥 During the recent market dip, BRETT emerged as the top-performing memecoin, supported by BASE's impressive network development progress. The price has only just returned to a key resistance level first reached in June, suggesting there’s still room for further growth.
📉 FLOKI, BRETT's closest competitor, maintains an edge with a stronger Volume/MarketCap ratio and listings on all major exchanges. However, trading volumes for FLOKI have dropped significantly, and its price chart shows weaker momentum compared to BRETT.
_____________________
📊 Want more useful analytics? Like and subscribe to stay up to date with the most relevant trading ideas!
Always DYOR! 🔬

$BRETT - Entry in Demand Zone, Target Above 50c$BRETT is currently in a small correction within a demand zone. Any price under 14c is a good entry point, with 12c being an excellent opportunity. If we see a drop to 12c, treat it as a gift.
Looking to sell above 50c, targeting a strong upside once the price rebounds from this zone.

BRETT USDT PRICE UNTIL MARCH 2024This is just a prediction about where I foresee price going over the next 4 months on Brett. Trading as low as 11 cents and as much as 24 cents.

Brett/USDT - Swing PostitionDate: 06/12/24
Name: Brett/USDT
Market cap
$2.01B
1.55%
Volume (24h)
$116.05M
10.51%
FDV
$2.01B
Vol/Mkt Cap (24h)
5.83%
Total supply
9.91B BRETT
Max. supply
10B BRETT
Circulating supply
9.91B BRETT
Daily Time Frame – Swing Position – Long!
Reasons to be Bullish Case:
1) Structure: Weekly Break of Structure
2) Current phase: Strong Bullish momentum, Trending upwards (daily Bos, Swing defined.
3) Overall trend: Continuation of Bull Trend.
(4) Internal: Structure Shift towards upside, Pull Back done, uptrend continuation, internal Shift, ready to sky rocket.
(5) Important Key notes: .
- 178 days for break of structure and Trending upwards
- Currently holding Previous resistance as its support and key level on Daily Time frame range.
Worst case Senerios:
4) Bitcoin is currently at All time high, liquidation flush remaining ($75k – $80k)
5) Due to liquidity generated and Demand zone sitting below.
6) if $0.15 is not hold, then we can see further buying opportunities on marked point of interests.
7) Invalidation below $0.07
8) Be Prepared at 0.3034 level, Can expect huge Sell pressure. (untested area before last selling. (huge Dump in history).
Trade Plans:
BUY CMP: $0.203
DCA: $0.08-0.13
Invalidation: $0.07
Trend Based Fibionacci Targets:
Target 1: $ 0.44
Target 2: $ 0.69
Target 3: $ 0.85
Target 4: $ 1.10
**This is not a financial advice, these are my personal trade journals, Do your own research before taking any action. **


BRETT Long Spot Trade (Buying the Dip) Market Context:
BRETT's current price action suggests that any dip into the $0.18 zone represents a strong buying opportunity. The setup shows potential for significant upside, with favorable risk-to-reward dynamics.
Trade Setup:
Entry Zone: Around $0.18
Take Profit Targets:
First target: $0.30
Second target: $0.50
Third target: $0.75
Stop Loss: Daily close below $0.15
This trade aims to capitalize on the dip into support, targeting substantial price expansion in the upcoming trend.

BRETTUSDTKey Level Zone : 0.18358 - 0.18952
HMT v1.0 detected. The setup looks promising, supported by a previous upward/downward trend with increasing volume and momentum, presenting an excellent reward-to-risk opportunity.
HMT (High Momentum Trending):
HMT is based on trend, momentum, volume, and market structure across multiple timeframes. It highlights setups with strong potential for upward movement and higher rewards.
Whenever I spot a signal for my own trading, I’ll share it. Please note that conducting a comprehensive analysis on a single timeframe chart can be quite challenging and sometimes confusing. I appreciate your understanding of the effort involved.
If you find this signal/analysis meaningful, kindly like and share it.
Thank you for your support~
Sharing this with love!
Brett Update ( 1D ) one of best MEME in base network #BRETT with 2B $ MarketCAP Has Reached ATH may be able to target even higher peaks. Make sure to keep an eye on it!

How perfectWith 7-star you know when to long and when to short. Though indicators are not predictors but they are definitely a ray of hope in a dark tunnel. Though we have included lot of logic into that buy and sell prints, we still want you to look other aspects because it's very difficult to predict the market.
If BTC keeps going down then we can see the sell print will go to the place where it started.
DYOR
For indicator access, you can contact me.

$BRETTUSDT Strong Cup Handle formation over 6 monthsBYBIT:BRETTUSDT on Base chain is going to explode after 6 months of Cup Handle. It is not too late to fill your bags 🚀

BRETT breaking outBRETT 1day breaking out of the bullflag with the Alpha Thrust throwing green y'day indicates continuation We still need another candle to close outside to confirm RSI backs it in flashing bull Resistance at ATH 0.195 double top before this latest bullflag correction I think the momentum might crush this level but being so significant a level may have to retest it before the circus starts

$BRETT 100X LEVERAGED LONG
CONVICTION
This chart doesn’t “correct.” It doesn’t “consolidate.” It hunts. Every time some paper-handed clown tries to short, $BRETT casually steps on their neck and climbs higher. What’s that? You’re waiting for a pullback? Yeah, keep waiting—might as well sit by the phone for a text from your ex while you’re at it.
Fundamentals? Cope.
Oh, you need “fundamentals”? Here’s a fundamental for you: Price go up. That’s all you need to know. Stop pretending you’re Warren Buffett; you’re a degenerate gambling on internet monopoly money, same as the rest of us. Own it. $BRETT doesn’t care about “use cases” or “intrinsic value.” The only utility here is crushing shorts and making the poor seethe.
No Poors Allowed
Let’s be clear: If you’re reading this and thinking about “risk management,” you’re not built for this. This is a long-only zone, and the minimum entry fee is your dignity. If you’re not max-leveraged, your account balance better have at least three commas, or this party’s not for you. We’re here to win, not to “stay safe.”
Why $BRETT?
Because it’s $BRETT, that’s why. It’s inevitable. You don’t argue with gravity, and you don’t argue with $BRETT. Trying to fight this pump is like trying to fistfight a hurricane—except in this case, the hurricane is laughing at you while lighting a cigar with your liquidation notice.
Final Thoughts
Max out your longs. Take out a second mortgage. Sell your car. I don’t care what you have to do, but if you’re not riding this rocket, you’ll be watching the rest of us from the ground like the broke NPC you are. This isn’t financial advice; this is financial survival. Cope and seethe, no-coiner peasants. $BRETT to $1, and we’re not waiting for you.

$BRETT Can Easily Make 10x Before The End Of The YearChart is quite clear an obvious. $BRETT is in a trending channel that looks like a massive bull flag.
Its consolidating nicely and is going to find a new ATH.
IMO this meme coin will be as big as PEPE or DOGE. It can make an 80x if I am optimistic and a 10x if I am pessimistic.
What do you think?

BRETT - MEMECOIN PROTAGONIST OF THIS BULL RUN - TRADE PLAN + TAMarket Overview
Current Price: 0.15859 USDT
24h Price Change: -3.16%
Volume: 1.93M
The asset has shown significant volatility in recent weeks, with strong price movement followed by consolidation.
Technical Indicators
VMC Cipher B Divergences: The VMC Cipher shows divergence patterns that can help detect potential reversals or trend continuation signals. There are several key points where divergences are visible in the current chart. The negative divergence near the price top could indicate potential downside or correction
.
RSI (Relative Strength Index): Currently at 44.73. This suggests the asset is not yet oversold or overbought but is hovering near the neutral zone. A rise above 50 could indicate bullish momentum, while a drop below 40 could indicate bearish sentiment.
MFI (Money Flow Index): At 41.52, the Money Flow Index is also near neutral. A value above 50 would indicate positive money flow, suggesting that buyers are in control. Below 50 points to selling pressure.
Stochastic Oscillator: Currently at 57.71 for the %K line, and 35.74 for the %D line. This is considered neutral but nearing an overbought zone. A crossover from below 20 could be a buy signal, while crossing above 80 would suggest an overbought condition and potential reversal.
Volume Analysis
Volume Spikes: The recent volume spikes suggest high market activity, with strong buying and selling forces at play. The presence of a high volume near the price peak indicates strong interest, but it also raises the possibility of a correction or consolidation.
Price Action
The chart shows a bullish trend over the past period, with a strong price increase followed by consolidation around the 0.158 level. This sideways movement could be a pause before either a further bullish breakout or a pullback.
Support Levels: Around 0.15 to 0.16, with the current price testing the lower support level.
Resistance Levels: Around 0.18 to 0.19, which could be the next target if the bullish momentum resumes.
Technical Patterns
Consolidation Phase: The price is in a consolidation phase, which is typical after a significant upward movement. It might test support levels before making another move.
Divergence: The negative divergence in the indicators suggests that if price action fails to break through key resistance, a bearish correction might occur.
Sentiment Analysis
Given the current neutral signals from the RSI, MFI, and Stochastic Oscillator, market sentiment is indecisive. Traders should watch for breakouts or breakdowns from key levels to gauge the next move.
Trading Plan for BRETT (BRETT/USDT)
Bullish Scenario
Entry Point:
If price breaks and sustains above the 0.16 level, this could signal a bullish continuation. A close above 0.18 would be a confirmation of a potential upward trend towards 0.20.
Targets:
Short-term target: 0.18 (first resistance zone).
Medium-term target: 0.20 or higher if the bullish momentum continues.
Stop Loss:
Set a stop loss just below 0.15 (the recent support level) to manage risk in case of a pullback.
Bearish Scenario
Entry Point:
If the price drops below the 0.15 support level, this could signal a short-term bearish move. A sustained breakdown below 0.14 would suggest further downside potential.
Targets:
Immediate target: 0.12, which would be a key support level.
Stop Loss:
For a short position, set a stop loss above 0.16 to limit the risk in case of a trend reversal.
Sideways Consolidation
Strategy:
If the price continues to move sideways, trade within the range by buying near the 0.15-0.16 support zone and selling near 0.18-0.19 resistance. This strategy would rely on short-term price movements and volatility.
Risk Management:
Always set stop losses just outside of support or resistance zones (around 0.14 for support and 0.20 for resistance).
Watch closely for breakout or breakdown signals above 0.16 or below 0.15.
Given the current neutral indicators, it’s wise to be patient and look for confirmation before entering large positions.
Maintain good risk management strategies, such as using tight stop losses and adjusting position size according to market conditions.
This plan takes into account both technical indicators and price action, but always stay updated with market news that may influence price movements.

Alikze »» BRETT | Ascending Channel - 1W🔍 Technical analysis: Ascending Channel - 1W
📣 COINEX:BRETTUSDT It is moving in an ascending channel on the weekly time frame.
🟢 It has had several positive reactions with demand at the bottom of the ascending channel.
🟢 Given the current momentum that is in the supply area and the middle of the ascending channel.
💎 If the current area is broken, it can grow to the 0.41 area.
⚠️ Given the recent zigzag correction at the bottom of the channel, it has encountered buying pressure candles that can be considered the LVL Invalidation range as invalidating the bullish trend analysis. ⚠️
»»»«««»»»«««»»»«««
Please support this idea 💡 with a LIKE 👍 and COMMENT 💬 if you find it useful and Click "Follow" on our profile if you'd like these trade ideas delivered straight to your email 📧 in the future.
🙏Thanks for your continued support.
Best Regards,❤️
Alikze.
»»»«««»»»«««»»»«««

#brett 4hIn the 4-hour timeframe, this cryptocurrency can be examined in the medium term with specified stop-loss and targets.

Just for me - Small trade in Brett BasedJust for fun. Saw their whitepaper, looks fun.
Hope it's gonna be the next shib or doge. Has a big fanbase.

BRETT - all time high and moon soon!?Brett - funny meme coin that retail likes to gamble on.
Brett is near all time high and a huge explosion is possible. If you don't already have a Brett position, it may be time to prepare for one. I see a pull back to 0.14 as healthy and a good entry before Brett picks up new power. Right now Retail is rushing into the market and it is not certain that there will be a pull back to the 0.5 fib level.
BRETT is risky with high volatility but with great potential.

BRETT/USDT NEW ATH EXPECTINGBRETT can show a new increase trend in the coming time.
There is a possibility for a new ATH in the coming period.
