BRETT on Base breaking outBRETT 1day on base #1 Meme is breaking out of the long-term downward trendline RSI flipping bullish MACD flipping bullish and pretty much blue sky back to ATH 6 months ago around 0.20 From there it's price discovery in what could be the most explosive bull market ever Current MC is 1.25Bln with around 600k holders and Coinbase onboarding retail investors the upside potential is massive Stay based
BRETTUSDT trade ideas

Meme Magic on BRETT: Don’t Miss This Bullish Trend!THIS IS A MUST BUY! 🚀 As most memes are currently flipping bullish, this one just fired a bullish signal right off the lows.
What’s to like? This is just the beginning of the weekly trend. Sure, it might seem a bit late, but if everything aligns, the swing is safe to take.
I can’t see a chart more bullish than this at weekly prices. Price targets are indicated by the boxes, so adjust your risk and go long now! 📈
Grab It Now, Cash In by November!💰📈

BRETT - POTENTIAL REBOUND - TECHNICAL ANALYSIS + TRADE PLANTrend Analysis:
The price is in a downtrend on the 4-hour timeframe, with lower highs and lower lows.
Recent candles show consolidation near the $0.07500–$0.07800 range, possibly signaling that sellers are taking profits, leading to some temporary support.
Volume Analysis:
The trading volume at 7.722M shows notable interest in BRETT, but it has not increased significantly to suggest a reversal.
Decreasing volume in a downtrend typically signals a potential for consolidation or a short-term reversal as selling pressure may weaken.
Momentum Indicators:
VMC Cipher B: The VMC Cipher B indicator shows mixed signals with green dots indicating potential bullish divergence, which could mean an upcoming price increase. However, the current momentum on VMC suggests a weak upward push, not strong enough to confirm a trend change.
RSI: At 36.55, the RSI is nearing oversold levels, suggesting the possibility of a short-term rebound but not necessarily a strong reversal. RSI has room to drop further before signaling a strong buying opportunity.
Stochastic: The stochastic oscillator shows an upward cross around 52.72, suggesting a potential buy signal. If the momentum continues, there may be a short-term move to the upside.
HMA-Hist (Hull Moving Average): This histogram shows mixed trends with no definitive sign of strong bullish or bearish pressure, indicating that the trend could go either way in the short term.
Key Support and Resistance Levels:
Support: The $0.07500 level is acting as the immediate support. A breakdown below this level could signal further downside.
Resistance: The $0.08500 and $0.09000 levels are nearby resistance points. If price breaks above these, it could confirm a trend reversal.
Trading Plan
Entry Strategy:
Short-Term Long Position: If the price holds above $0.07500 and RSI remains oversold, consider a short-term long entry with a target near $0.08500. Enter only if there is confirmation from both the RSI and Stochastic crossing upwards.
Breakout Long Position: If the price breaks above $0.08500 with high volume, consider a long position, as it may signal a bullish reversal. Look for further confirmation from the VMC Cipher B and a continued upward trend on Stochastic.
Stop Loss:
Place a stop loss below $0.07300 for long positions to limit potential losses if the price breaks the current support.
Target Levels:
Take Profit (TP) 1: $0.08500 – This is the immediate resistance level. Take partial profit here if the price approaches this level.
Take Profit (TP) 2: $0.09000 – If the price sustains above $0.08500, consider holding until $0.09000 for additional profit.
Risk Management:
Risk-Reward Ratio: Aim for a minimum 2:1 risk-reward ratio by adjusting entry points and take profit levels.
Position Sizing: Limit exposure to a small percentage of the portfolio to manage volatility and avoid significant losses in case the price continues to drop.
Monitoring:
Continuously monitor the volume and momentum indicators (RSI, Stochastic) for any changes that could signal a continuation or reversal of the current trend.
Be cautious of market-wide trends and news that could impact overall crypto market sentiment, as this could affect BRETT’s price movement.

BRETT ANALYSIS🚀#BRETT Analysis : Pattern Formation
🔮As we can see in the chart of #BRETT that there is a formation of Inverse Head And Shoulder Pattern and it's a bullish pattern. Also we can see a breakout here. Around 20-40% bullish move is pending in #BRETT
🔰Current Price: $0.10990
🎯 Target Price: $0.1330
⚡️What to do ?
👀Keep an eye on #BRETT price action. We can trade according to the chart and make some profits⚡️⚡️
#BRETT #Cryptocurrency #TechnicalAnalysis #DYOR

$BRETT from 0.9137 to 0.1516Long
The coin is approaching the activation zone for the third time, which will automatically lead to its breakout. However, there might be a pullback to the 0.93 zone in order to complete the Hall Correction Level on lower timeframes, and only after that, it will move towards 0.15.

BRETT Long Spot Position (Key Zone Test)Market Context: BRETT is displaying minor higher lows but hasn't confirmed significant higher highs yet. As the price approaches the $0.07 level, it enters a critical zone where market makers could potentially sweep the lows and form a double bottom, offering a strong risk-to-reward setup.
Trade Setup:
Entry: Around the $0.07 area.
Take Profit:
First target: $0.11
Second target: $0.14
Third target: $0.17
Stop Loss: Daily close below $0.05.
This trade offers a favourable risk-to-reward ratio as we aim to capitalize on the potential double bottom formation. #BRETT #Crypto

BRETTUSDT - Possible Buy Opportunity on BRETTBrett is a community based meme token. Brett aims to leverage the power of such an iconic meme to become the most memeable ...
Brett (BRETT) is a memecoin and the official mascot of the Base Chain, inspired by the character Brett from Matt Furie's Boys' Club comic series.
Looking at the RSI on the 1-hour, 1-day and 1-week intervals they are all at the bottom of the range with allot of up-side potential. Apart from the small correction on the 1-hour chart, BRETT is already at support and allows for a buy opportunity at these levels.

BRETTUSDT.P A Potential Bullish Setup!!BRETTUSDT.P chart is showing a potentially bullish pattern on the daily timeframe, around the 61.8% Fibonacci retracement level and a long-term trendline originating from May 14, 2024.
BTCUSDT.P has been retesting the 200-day EMA for three consecutive days, indicating a zone of high interest.
Important Note: This analysis is based on a candle that has not yet closed. It’s crucial to wait for confirmation with a full daily candle close above the trendline and Fibonacci level before considering a trade and sometimes even wait for double retest.
This idea adds clarity that the analysis is anticipatory, giving traders a heads-up on a potential setup.

Setting up for a Green Line Breakout Hey folks, I have been adding to my Brett bags the past couple of weeks, it has charted nicely, and I thought I should share my perspective, since it's been playing out. I am looking for a break above resistance at .1066 to confirm its direction to the next highest node on the VRVP, or potentially much higher.
My long price target is at least $1-$1.50, potentially even $2-$3 at its peak.
Thank you for your time,
OnePath


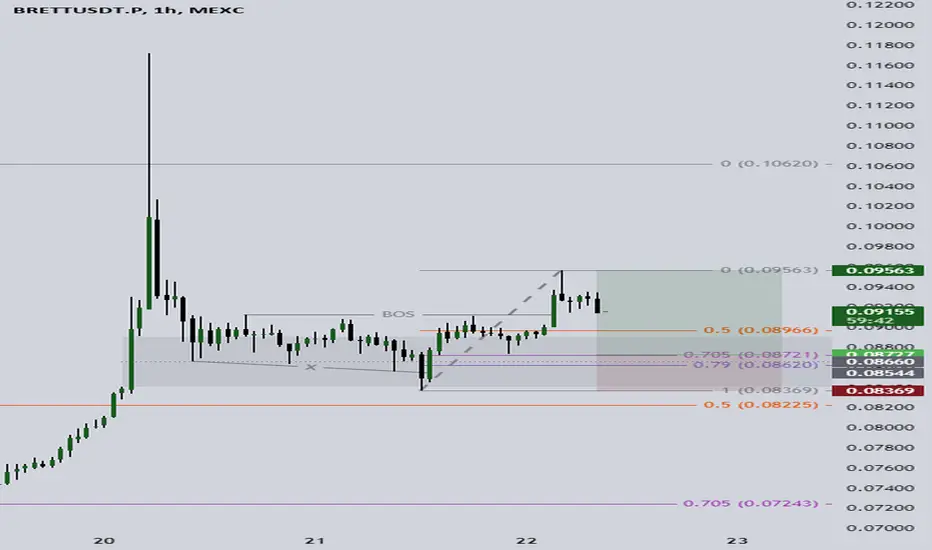
$BRETT breaking out .... $BRETT breaking out, break of structure - forming a HH after a HL - coming up to a test of keys MA/s .. my first TP zone

BRETT LONG SETUP ALL trading ideas have entry point + stop loss + take profit + Risk level.
hello Traders, here is the full analysis for this pair, let me know in the comment section below if you have any questions, the entry will be taken only if all rules of the strategies will be satisfied. I suggest you keep this pair on your watchlist and see if the rules of your strategy are satisfied. Please also refer to the Important Risk Notice linked below.
Disclaimer

Brett (BRETT/USDT) TECHNICAL ANALYSIS + PRICE PREDICTIONTechnical Analysis by Blaž Fabjan
Price Movement:
The asset shows a clear downtrend, followed by a short period of consolidation, and it is now breaking through a resistance level.
There is a marked bullish pattern, indicated by the breakout from a flag/pennant formation (shown by the blue upward line). This is often a continuation pattern signaling that the prior trend may resume after the consolidation.
Resistance Level:
There is a horizontal resistance line that has been marked. The price seems to be challenging this resistance after breaking out of a small downward consolidation channel (the flag pattern).
Indicators:
VMC Cipher B Divergences: This indicator shows a bullish divergence (green dots). The blue wave in the oscillator indicates increasing bullish momentum, which supports the potential for an upward move.
RSI (14): The RSI stands at around 52.62, showing neutral to slightly bullish conditions. This leaves room for a potential upward move without being in overbought territory.
Stochastic RSI (14,3): The Stoch RSI is currently at 62.37, showing that there might be a slight pullback in the short term, but overall, it is still in a favorable range for buying as it is not overbought.
Trading Plan:
Entry:
Based on the breakout above the resistance line and the upward momentum, the chart marks a "good buy option" point right after the breakout of the downward consolidation channel.
An entry around the current price of 0.0880 USDT would align with this technical signal, as it is near the breakout zone.
Stop Loss:
A safe stop loss could be placed just below the recent consolidation low at around 0.0700 USDT. This level would invalidate the bullish setup if the price were to fall below it.
Take Profit:
The target for this move could be aligned with the previous swing highs. The chart suggests a potential move toward the 0.1000 USDT level, which could be a conservative take-profit point based on the prior trend.
If momentum continues strongly, the next possible target could be at 0.1100 USDT.
Risk/Reward Ratio:
Entry at 0.0880 USDT, stop loss at 0.0700 USDT, and take profit at 0.1000 USDT gives a risk/reward ratio of approximately 1:2, which is a reasonable trade setup.
Conclusion:
This chart suggests a potential short-term bullish opportunity for BRETT/USDT, particularly if the breakout is sustained. Based on the current indicators, a pullback could be expected, but the overall trend points towards upward momentum, making it a good buying opportunity if proper risk management is applied.

BRETT/USDT: ABOUT TO BREAK OUT! 150% MOVE EXPECTED!!Hey everyone!
If you enjoy this analysis, a thumbs up and follow would be greatly appreciated!
BRETT looks good here. It tries to break out from the descending triangle in the daily time frame. A confirmed daily close above the triangle would lead to a 100-150% move to the upside.
Entry range:- $0.07-$0.08
Target:- 100-150%
SL:- $0.056
What are your thoughts on BRETT's current price action? Do you see a bullish pattern? Share your analysis in the comments below!

BRETTUSDT $BRETT I would not miss this long if I were you
BTC is on the verge of reversal . Give it a few more time to stabilize around these levels and alts should pop soon . Unless BTC nukes under 60k , this should be an easy play

BRETTUSDT.P ICT2022 MODEL (THU 22/08/24)1H TF
liqudity swept
break market structure
entry at 1h +OB
sl at swing low
tp at swing high
BRETT SETUP WITH PRO STRATEGYFirst we see a large pattern known in technical analysis as a bullish flag, characterized by an impulse and a retracement without losing the beginning of the impulse, however we observe that this pattern extends for about 98 days without a breakout or even a false breakout based on the 1-day time frame, we see that it is an asset that respects classical and graphic technical analysis with breakouts worked out in efficient ways and respecting graphic figures in ways that textbooks teach, today we had the first breakout of a symmetrical triangle or descending wedge pattern at 0. 08069. 08069, however in an analysis of orders we see a big player who sold absurd numbers of Brett at a price of 0. 0900 WHICH COMES INTO COFLUENCE WITH MY CONTROL ZONE identified on the chart which makes me consider with a statistical probability of 90% A SHORT IN THIS REGION PROTECTING ME WITH THEIR MONEY, however as we are professionals and do not act on the emotion of the moment without FOMO or FUD, we should wait based on the gf1 indicators for the loss of the level of 0. 07721 for a safe short with a high statistical probability of reaching the minimum level of the descending channel created since JUNE 7, 2024, knowing that this asset has little data for analysis in longer time frames, we have 1 day in an uptrend and 8 hours evolving into a downtrend, as 4 hours is the reversal time frame and it is losing buying strength, which underscores my thesis on this asset, in addition to the oscillator showing that it is in a clear and strong bear zone.
STRATEGIC SUMMARY:
AT THE MOMENT THE ASSET IS CLEARLY AUTISTIC ON A 1-DAY TIME FRAME, SELL IF IT LOSES 0.77221 WITH A TARGET AT 0.05866 WHICH IS THE OLD RANGE AND A SECOND TARGET AT 0.037 THE BASE OF THE BEARISH CHANNEL.
BUY IF IT BREAKS THROUGH 0.09582 AND SELL TARGET 1 AT 0.1173 AND TARGET 2 AT 0.25822.

BRETT/USDT Breakdown: Next Stop $0.080?The 15-minute chart for BRETT/USDT shows a bearish structure with a potential breakdown on the horizon.
The price has been moving sideways within a tight range, but it recently breached the key support level at $0.08483, signaling possible further downside momentum.
The shaded blue area on the chart represents a potential drop zone, where the price could decline if bearish pressure continues.
The next major support level to watch is $0.080, which could be a significant target for short sellers.
Given the break below support and the retest of the breakdown point, the price is likely to continue lower if it fails to regain the $0.08536 level.


BRETT CyclesHave we seen Brett like this before? I think we have, the altcoin market has not been good and we are expecting for choppy times, what I propose is Brett being on a similar position on a lower marketcap and shorter timeframe, this same projection has been playing out quite similarly and might give us some clue to what can happen. COINEX:BRETTUSDT

$BRETT getting ready for another push to ATHMassive hidden bullish divergance currently shown. $BRETT has been making waves in the crypto space as being the largest memecoin on base chain & also the first memecoin on base to reach a billion mrktcap. Thesis is $BRETT will follow PEPE as ETH makes new highs.

BRETT Continues To Trade At Support LevelBrett has been trading in a bull flag for more than two months. During that time, the token made several unsuccessful attempts to breakout of the flag.
Conversely, the latest sell-off temporarily pushed the price below the lower trend line. However, Brett moved back into the channel quickly.
➡️ Where are we now?
Although Brett trades back in the bull flag, it hasn't been able to gain substantial momentum. Conversely, it remained close to the support line. Additionally, a break of the short-term downtrend (EMA25) was rejected. As a result, Brett trades in a clear downtrend on the 4H chart (price below EMA200, 100, and 25).
🧐 What to do?
I am cautious with short-term long trades. Since the trend clearly shows a downtrend, you will only go short at this time. As the first promising signal, we need the price to move above the EMA25 and, even better, the EMA25 to move above the EMA100. Until then, I will keep my feet still. No trade position is a position, too!

BRETT Technical Analysis in a Daily TimeframeHello everyone, I’m Cryptorphic.
For the past seven years, I’ve been sharing insightful charts and analysis.
Follow me for:
~ Unbiased analyses on trending altcoins.
~ Identifying altcoins with 10x-50x potential.
~ Futures trade setups.
~ Daily updates on Bitcoin and Ethereum.
~ High time frame (HTF) market bottom and top calls.
~ Short-term market movements.
~ Charts supported by critical fundamentals.
Now, let’s dive into this chart analysis:
In this daily timeframe, BRETT is showing a rebound from the support level of $0.08143. The price is currently at $0.09923, and if the market favors the bulls, BRETT will likely rally toward the $0.1324 resistance trendline.
Key levels:
- Primary Support: $0.08143
- Resistance: $0.1324
- Upper Resistance: $0.1955
- Invalidation: A close below the support level.
DYOR. NFA.
Please hit the like button to support my content and share your thoughts in the comment section. Feel free to request any chart analysis you’d like to see!
Thanks
