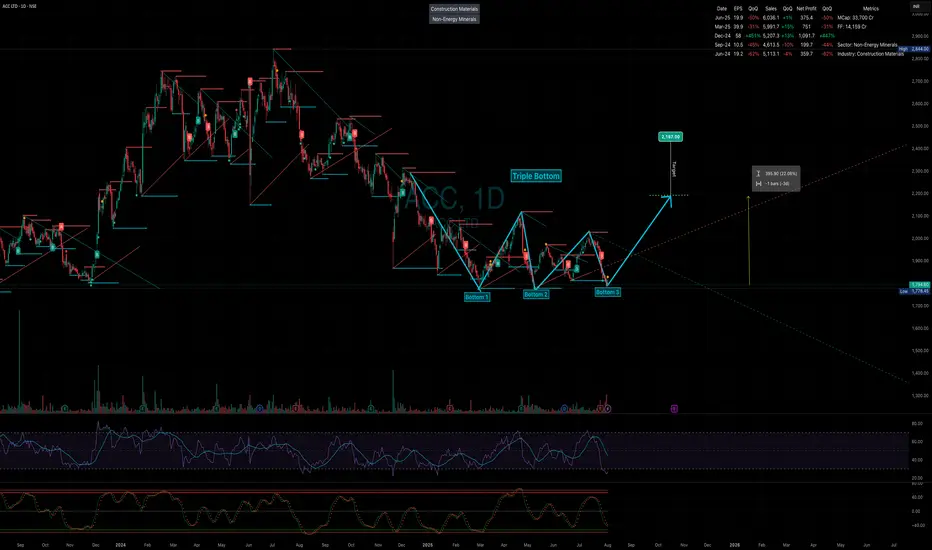
ACC Ltd. – Triple Bottom Pattern | Swing Trade Setup
ACC Ltd. is currently showing a Triple Bottom formation on the weekly chart, indicating strong support around the ₹1810 - ₹1793 level . This pattern suggests that bearish pressure is weakening and a potential reversal is on the cards.
🔍 Key Technical Highlights:
Triple Bottom: The stock has teste
Next report date
—
Report period
—
EPS estimate
—
Revenue estimate
—
128.75 INR
24.02 B INR
207.89 B INR
78.90 M
About ACC LTD
Sector
Industry
CEO
Vinod Mohanlal Bahety
Website
Headquarters
Ahmedabad
Founded
1936
ISIN
INE012A01025
FIGI
BBG000CNM7Y8
ACC Ltd. engages in the manufacture and sale of various kinds of cements. It operates through the following segments: Cement and Ready Mix Concrete. The Cement segment is a clinker resulting from mixing at suitable rates, grinding and firing raw material such as limestone, clay, iron ore, fly ash, bauxite and certain amount of setting regulator are ground together and set after mixing with water and gains strength. The Ready Mix Concrete segment is concrete that is manufactured in a batch plant, according to a set engineered mix design. The company was founded on August 1, 1936 and is headquartered in Ahmedabad, India.
Related stocks

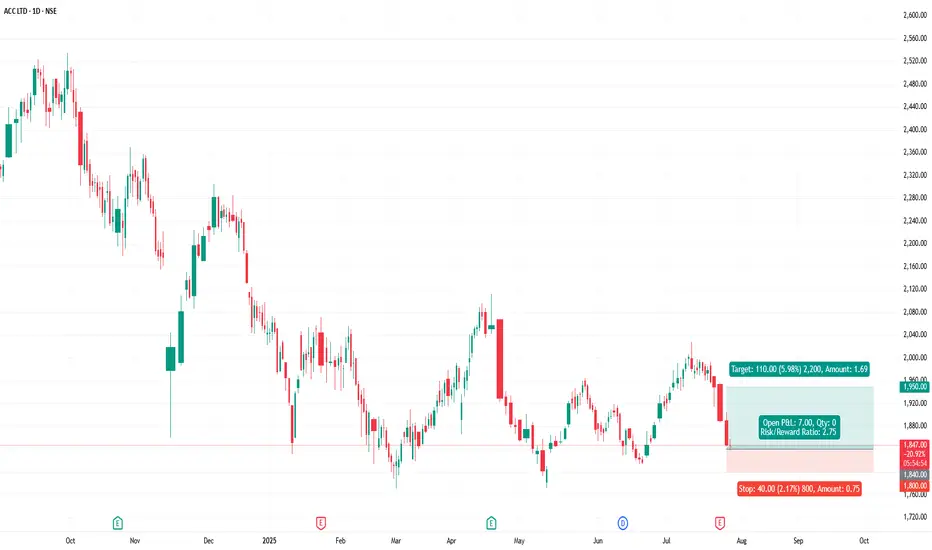
ACC - ACC Ltd (Daily chart, NSE) - Long PositionACC - ACC Ltd (Daily chart, NSE) - Long Position
Risk assessment: Medium {support structure integrity risk}
Risk/Reward ratio ~ 2.75
Current Market Price (CMP) ~ 1848
Entry limit ~ 1845 to 1835 (Avg. - 1840) on July 28, 2025
Target limit ~1950 (+5.98%; +110 points)
Stop order limit ~ 1800 (-2.1
ACC Trade Setup for the Week(14–18 July 2025) – Uptrend ChannelACC Ltd. (NSE: ACC) has been trading inside a clean uptrend channel for the past few weeks, bouncing consistently between rising support and resistance. Now, it approaches a critical inflection point — the lower support of the channel.
While no breakdown has occurred yet, the structure is weakening

ACC BULL waves started BIG Giant Ready to Roll !!!ACC daily counts suggested DUAL match for Eillot waves + Harmonics bullish Wave structure
both looks bullish implus started for this stock
LONG TERM investors get ready for good returns in future for 2 to 5 yrs
all charts shown to understand elliot waves theory + harmonics waves + gann the

ACC - FOR SWING TRADE Currently price is making a Double Bottom pattern in weekly time frame.
After a trendline breakout price hunt all the buyers stoploss downside.
Now price is again showing us a bullish move with the good bullish engulfing candle in weekly time frame.


ACC BuyACC shares seem to take support after breaking the channel resistance line. Buy @CMP (1850) with a SL of 1775 and target of 1950 & 2100.

ACC given breakout . Target 2100ACC 1959 has given a good breakout. Expected to test 2100.
It is undervalued and is capable of moving to target 2,848

ACC Short play idea for May 2025ACC, daily charts, spot prices. Price is already in downtrend. It has broken below a channel. Price objective is 190 points below breakout from the lower trendline. An alert has been set for tgt price at 1735

See all ideas
Summarizing what the indicators are suggesting.
Neutral
SellBuy
Strong sellStrong buy
Strong sellSellNeutralBuyStrong buy
Neutral
SellBuy
Strong sellStrong buy
Strong sellSellNeutralBuyStrong buy
Neutral
SellBuy
Strong sellStrong buy
Strong sellSellNeutralBuyStrong buy
An aggregate view of professional's ratings.
Neutral
SellBuy
Strong sellStrong buy
Strong sellSellNeutralBuyStrong buy
Neutral
SellBuy
Strong sellStrong buy
Strong sellSellNeutralBuyStrong buy
Neutral
SellBuy
Strong sellStrong buy
Strong sellSellNeutralBuyStrong buy
Displays a symbol's price movements over previous years to identify recurring trends.
Frequently Asked Questions
The current price of ACC is 1,794.15 INR — it has increased by 0.32% in the past 24 hours. Watch ACC LTD. stock price performance more closely on the chart.
Depending on the exchange, the stock ticker may vary. For instance, on BSE exchange ACC LTD. stocks are traded under the ticker ACC.
ACC stock has fallen by −5.54% compared to the previous week, the month change is a −6.94% fall, over the last year ACC LTD. has showed a −30.61% decrease.
We've gathered analysts' opinions on ACC LTD. future price: according to them, ACC price has a max estimate of 2,550.00 INR and a min estimate of 1,670.00 INR. Watch ACC chart and read a more detailed ACC LTD. stock forecast: see what analysts think of ACC LTD. and suggest that you do with its stocks.
ACC stock is 1.83% volatile and has beta coefficient of 0.86. Track ACC LTD. stock price on the chart and check out the list of the most volatile stocks — is ACC LTD. there?
Today ACC LTD. has the market capitalization of 336.92 B, it has decreased by −0.47% over the last week.
Yes, you can track ACC LTD. financials in yearly and quarterly reports right on TradingView.
ACC LTD. is going to release the next earnings report on Oct 22, 2025. Keep track of upcoming events with our Earnings Calendar.
ACC earnings for the last quarter are 20.00 INR per share, whereas the estimation was 30.86 INR resulting in a −35.18% surprise. The estimated earnings for the next quarter are 7.34 INR per share. See more details about ACC LTD. earnings.
ACC LTD. revenue for the last quarter amounts to 60.84 B INR, despite the estimated figure of 57.48 B INR. In the next quarter, revenue is expected to reach 52.55 B INR.
ACC net income for the last quarter is 3.75 B INR, while the quarter before that showed 7.51 B INR of net income which accounts for −50.02% change. Track more ACC LTD. financial stats to get the full picture.
Yes, ACC dividends are paid annually. The last dividend per share was 7.50 INR. As of today, Dividend Yield (TTM)% is 0.42%. Tracking ACC LTD. dividends might help you take more informed decisions.
ACC LTD. dividend yield was 0.39% in 2024, and payout ratio reached 5.86%. The year before the numbers were 0.30% and 6.03% correspondingly. See high-dividend stocks and find more opportunities for your portfolio.
As of Aug 2, 2025, the company has 3.17 K employees. See our rating of the largest employees — is ACC LTD. on this list?
EBITDA measures a company's operating performance, its growth signifies an improvement in the efficiency of a company. ACC LTD. EBITDA is 23.14 B INR, and current EBITDA margin is 10.25%. See more stats in ACC LTD. financial statements.
Like other stocks, ACC shares are traded on stock exchanges, e.g. Nasdaq, Nyse, Euronext, and the easiest way to buy them is through an online stock broker. To do this, you need to open an account and follow a broker's procedures, then start trading. You can trade ACC LTD. stock right from TradingView charts — choose your broker and connect to your account.
Investing in stocks requires a comprehensive research: you should carefully study all the available data, e.g. company's financials, related news, and its technical analysis. So ACC LTD. technincal analysis shows the sell today, and its 1 week rating is sell. Since market conditions are prone to changes, it's worth looking a bit further into the future — according to the 1 month rating ACC LTD. stock shows the sell signal. See more of ACC LTD. technicals for a more comprehensive analysis.
If you're still not sure, try looking for inspiration in our curated watchlists.
If you're still not sure, try looking for inspiration in our curated watchlists.