ADANIENT trade ideas

ADANIENT LONG (INTRADAY DEC 5)Hello TradingView community and my followers, please if you like the ideas, don't forget to support them with likes and comments, thank you very much and here we go.
.
ADANIENT
Daily : Stock is in uptrend.
15 min : It has broken Ascending triangle and has currently coming near support.
*Wait for the opportunity and we could see an upside movement.
THANK YOU !!!!

Adani Enterprises - Breakout and RetestBreakout and retest pattern
Just wait for a bulling candle and enter the trade
Stop loss below 200EMA
Target 1:2

ADANI ENTERPRISESIt's Adani century its is making high and high now it can again make new all time high high possiblities...

Adani Ent Look Neutral, It may go Down n Consolidate inside zoneDisclaimer
The information and publications are not meant to be, and do not constitute, financial, investment, trading, or other types of advice or recommendations supplied or endorsed by TradingView.

ADANIENT LONG (INTRADAY NOV 14)Hello TradingView community and my followers, please if you like the ideas, don't forget to support them with likes and comments, thank you very much and here we go.
.
ADANIENT stock is super bullish on daily candle and in 15 min it has broken "Bullish Pennant" and now it has made inverted "Head And Shoulder" pattern so now on breakout we could see upside momentum. Thank You !

ADANIENT LONG (INTRADAY NOV 11)Hello TradingView community and my followers, please if you like the ideas, don't forget to support them with likes and comments, thank you very much and here we go.
.
ADANIENT is super Bullish and it has made bullish mother baby candle on daily timeframe and in 15 min it has made bullish pennant pattern. Now wait for breakout then we could see some upside movement.
Thanks a Million !

New swing on adani enterprises A new swing is created on adani enterprises in daily charts. Buy at current levels of 3900 -3950 with a strict Stop loss of 3780 for the first targets of 4200.It may go upto 4500 in upcoming days but keep stoploss strict.

ADANIENT Break His All Time High !!!ADANIENT break his all time high with good volume
Entry at 4012
Target at 4390
Stop Loss at 3820

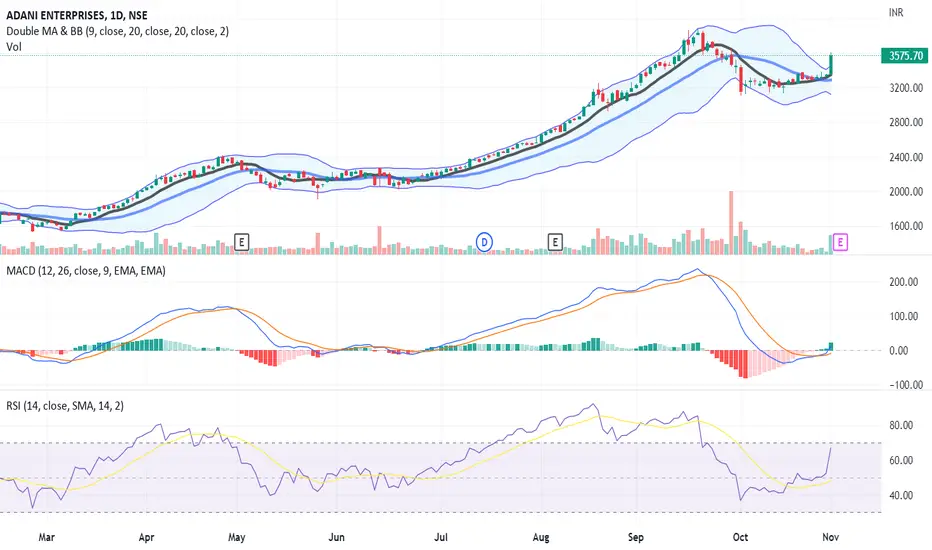
ADANI ENTERPRISES LIMITED - Volume Breakout + Bullish on Chart📊 Script: ADANIENT (ADANI ENTERPRISES LIMITED)
📊 Nifty50 Stock: NO
📊 Sectoral Index: NIFTY 500 / NIFTY METAL / NIFTY NEXT 50
📊 Sector: Commodities Metals & Mining
📊 Industry: Metals & Minerals Trading
Key highlights: 💡⚡
📈 Script is trading at upper band of Bollinger Bands (BB) and giving breakout of it.
📈 MACD is giving crossover.
📈 Double Moving Averages giving crossover.
📈 Volume is increasing along with price which is volume breakout.
📈 Current RSI is around 67.
📈 One can go for Swing Trade.
⏱️ C.M.P 📑💰- 3575.70
🟢 Target 🎯🏆 - 3885
⚠️ Stoploss ☠️🚫 - 3417
⚠️ Important: Always maintain your Risk & Reward Ratio.
⚠️ Purely technical based pick.
✅Like and follow to never miss a new idea!✅
Disclaimer: I am not SEBI Registered Advisor. My posts are purely for training and educational purposes.
Eat🍜 Sleep😴 TradingView📈 Repeat🔁
Happy learning with trading. Cheers!🥂
Adanient in strong resistance areaAdanient in strong resistance area
3880-3900 will be hurdle.. break then more upside move expectation....
Or else rejection from todays high area

Adani Enterprises Rounding Bottom formation*Adani Enterprises*
Time Frame: Daily
Observation:
* Rounding Bottom formation
* Swing High Break
Resistance/Target: 4300 5048 5484 5777 6222
Support: 3330 3177

#ADANIENT Weekly Major Support & Resistance Levels.Providing Weekly Support and Resistance levels for next coming week based on Central Pivot Range and its major support & resistance levels of week, where price can take support and face resistance. Three black lines indicating weekly Central Pivot Range. Previous week high & low also performs as a major support and resistance levels. Can take long & short positions according to how price perfoms at particular given support & resistance levels.

ADANIENT LONG (INTRADAY NOV 4)ADANI ENTERPRISES is in uptrend on daily and in 15 min it has made ascending triangle and now on breakout it could move upside. Thank you !

ADANI ENTERPRISESAdani ent 1 day chart support 3130 and 3380 respectively resistance is all time high

ADANI ENTERPRISES STAGES!!BLUE CIRCLE: is the consolidated market after the nifty 50 gave its bull run recently after June 20th.
ORANGE CIRCLE: is the buying and selling, basically the manipulation of stocks for the short period.
RED CIRCLE: and now the current stage, where the stock is forming A HIGHER LOWS PATTERN, chance to give a breakout.
PURPLE LINE: is a support.

Adani enterprises in a Channel (4th or B wave) Adani Enterprises is in a no trade zone, could give a breakout or breakdown as per given chart. Trades only and only to be taken on the Breakout or Breakdown

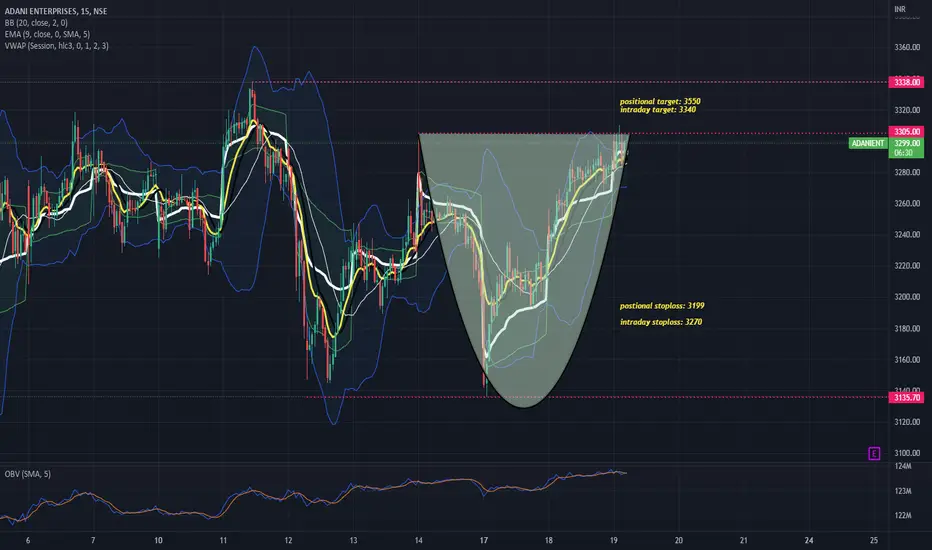
AdaniEnt-the greatAdaniEnt made rounding bottom formation on smaller TF with decent volumes, though its facing resistance @ 3305 levels, if it breaks 3305 again then it's a buy.
With mentioned stoplosses & targets for positional & intraday.
Pullback View for ADANIENTI am expecting pullback on NSE:ADANIENT
Best entry level is 3179 with strict stop loss of 3105. Can hold Adani Enterprises for two targets which is 3293 & 3401. If price sustain above 3401. It will take more upper side move.
Note: This is my personal analysis, only for learning.
Thanks.

Adani Group Share Trend 2022The share trend of adani group is downtrend, it is time to position lighting in adani group share.

ADANI ENTERTAINMENT POSSIBLE CHART OVERVIEWAs there is no such new open position are increasing and it is taking a support at that level by forming a cluster, and it is beating nifty hence if there is a range breakout on the upside and the rsi crosses 50 there is possibility of upside movement

Adani enterprises chart look scary nowAdani enterprises daily chart looks scary now ,just because the volume candle of previous day is such big and support is hard to find out is also now part of nifty 50

ADANI ENTERPRISESAdani ent is making new high on every week from last 2 years. in 1h hourly time frame we can see here it is facing resistance of 0.5 fibbo level zone. if the stock breaks down the the trend line then we can a fall up to next support zone which we can see here in the chart.
