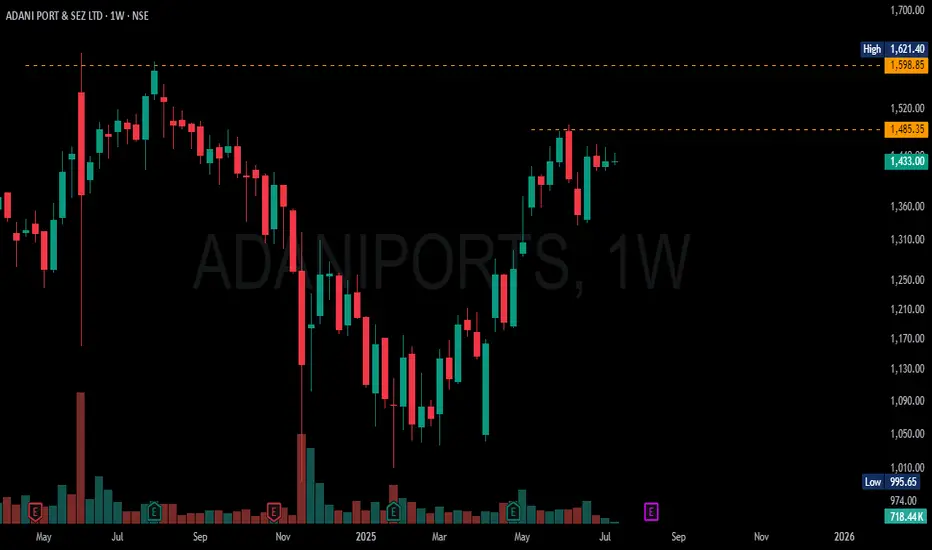
ADANIPORTS READY TO GOADANIPORTS is almost ready to break its nearest high and there after in the making of new high, as the volume feature shows investors are holding tight no sellers left, so there is short supply.
ADANIPORTS trade ideas
Adani Ports Long_ Support @ 20 Daily EMAAdani Ports Long:
1. After Golden Cross - Price first time pulled back
to 50 DEMA & then took support now at 20 DEMA
2. Enter Long when you get attractive Entry prices
based on lower timeframe
3. SL - Close below 20 DEMA
4. Caution: Today volume is not so great

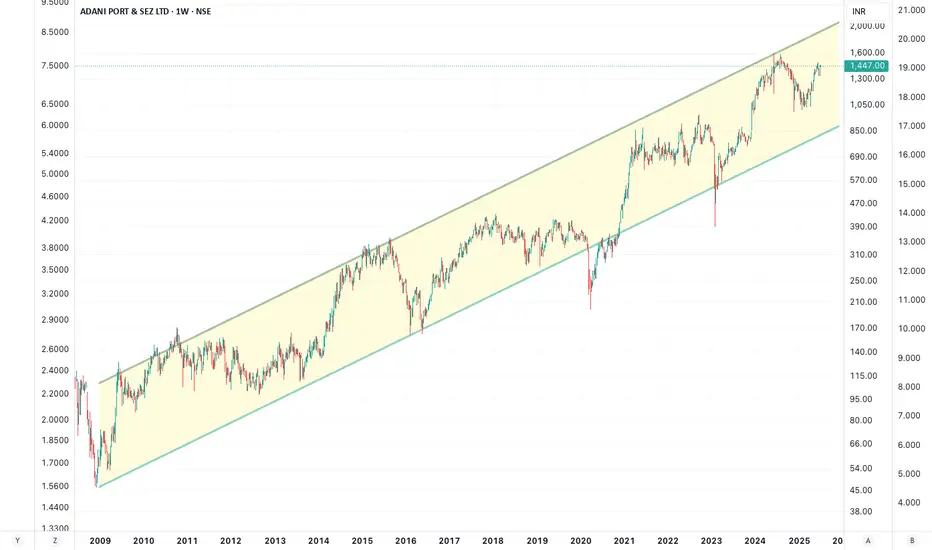
Adani PortAdani Port , 27X, CAGR 25%
16 years, consistently chugging along
Hindenburg
Hamas
Haifa
Nothing could stop this Titan.
India-Middle East-Europe Economic Corridor (IMEC) when operational will make this into a 5 lakh crore company.
strong technical uptrendeverything mention about in my chart
I am not sebi reg
just my own technical analysis
happy trading
Happy good day....

Adani Ports - My Pick, No Financial Advice or RecomendationStock is making HH & HLs, Taken first support at 50 DMA after golden crossover. Stock has also taken support at previous gap. Over all bullish. Close above 1373 with good volumes will tigger my entry. simple trade idea - no complex analysis.

Adani Ports – Bullish Momentum?Stock breaking above 50DMA, next resistance at ₹1175-₹1200.
🔹 Breakout above ₹1200 = strong uptrend
🔹 Target: ₹1400
🔹 Stop Loss: ₹1100
📌 Volume confirmation needed. DYOR.
#StockMarket #Trading #Investing #AdaniPorts #NSE #BSE #SwingTrading #TechnicalAnalysis #Breakout #IndiaStocks

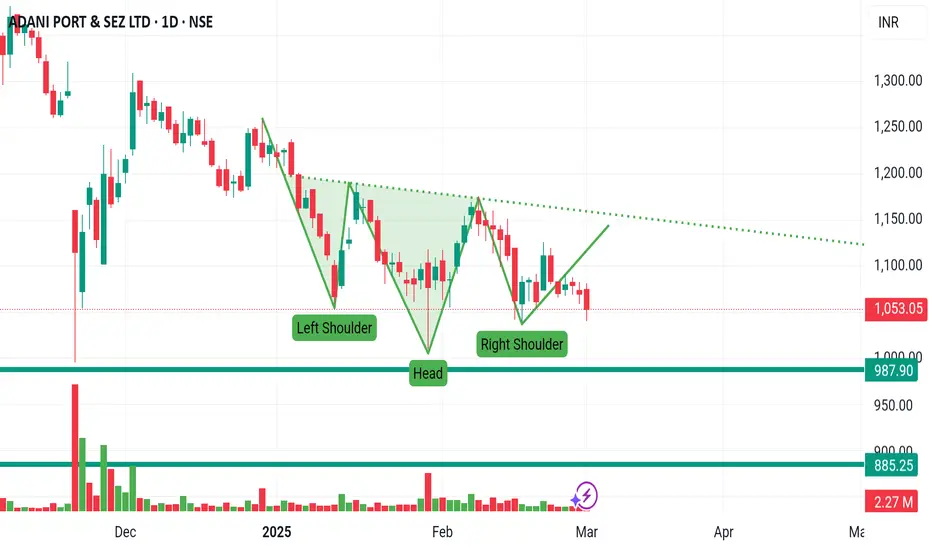
ADANI PORTS - INVERSE HEAD & SHOULDERS ON DAILY CHART !!!- Hey Folks, I was checking the charts and there is a possibility that adani ports may form inverse head & shoulders.
- To buy or to go long in this stock we need three confirmation first the right shoulder second the candle should broke the trend line and once trend line is broken we need one more confirmation candle to enter the trade.
- If it won't form the the inverse H&S still there is weekly support around 987-990.
- now if we talk about target it will 5%-7% becoz as the market is like a falling knife or bears in control so its not a good time to be greedy unless you are long term investor.
-Stopless will be 3%-5% if it breaks 987-988.
*** This are my personal views or analysis and not a recommendation***
ADANIPORTS : LOOKING FOR A POTENTIAL BOUNCE!🚀 ADANIPORTS Trade Idea - Daily Chart 📈
Looking for a potential bounce!
🛡️ Price: Around 1128 INR (currently) - Consider scaling in if it reaches the "Target at Wave C (intermediate wave)" zone of 1051-1094 INR.
🎯 Target 1: 1341-1372 INR (Wave C target zone)
🎯 Target 2: 1474 INR (Second Target)
🛑 Stop-Loss: Day close below 1051 INR
🤔 Why this trade?
✅ Extended retracement suggests potential support/reversal zone.✅ Approaching Wave C target zone - potential strong support.✅ Potential for a good Risk/Reward.
💡 Pro Tip: The chart highlights a "New demand Zone at extended retracement zone" and a "Retracement zone for Wave B." If the price dips further, watch for strong buying volume or bullish candlestick patterns within the 1051-1094 INR zone as confirmation of a reversal before entering. Consider using a smaller initial position size and adding to it if the price shows strength within the zone.
⚠️ Risk/Reward Calculation (Example - You MUST calculate your own based on YOUR entry):
Let's assume entry at 1072 INR (midpoint of the Wave C target zone) and the defined stop-loss of 1051 INR:
Potential Gain ( Target 1 - using midpoint ): 1356 - 1072 = 284 INR
Potential Loss: 1072 - 1051 = 21 INR
Risk/Reward Ratio ( Target 1 ): 284 / 21 = Approximately 13.5:1
Potential Gain ( Target 2 ): 1474 - 1072 = 402 INR
Risk/Reward Ratio ( Target 2 ): 402 / 21 = Approximately 19.1:1
🙏 Important:
⚠️ This is just an idea, not financial advice.😟 Trading has risks – you could lose money.🧐 Do your own research before making any trades.

Adani Port & SEZ Ltd.*Adani Port & SEZ Ltd.*
*W* on Daily & Weekly Basis.
Morning Star Formation on Weekly Basis underway.
Good Volume Traction.
*Trail SL with Upside*
*Book Profit as per Risk Appetite*
*This is an Opinion. Do your own research.*
*_Happy Investing_*🤓

Adani Ports Buy On 200 Weeks EMAAdani Ports and Special Economic Zone Limited (APSEZ) is India's largest private port operator and an integral part of the Adani Group, a prominent Indian multinational conglomerate. Established in 2001, APSEZ has significantly expanded its operations, managing a network of 12 ports and terminals across seven maritime states in India, including Gujarat, Maharashtra, Goa, Kerala, Andhra Pradesh, Tamil Nadu, and Odisha. (
**Key Details:**
- **Founded:** 2001
- **Headquarters:** Ahmedabad, Gujarat, India
- **Managing Director & CEO:** Karan Gautam Adani
**Core Business Segments:**
1. **Port Operations:**
- Development, operation, and maintenance of port infrastructure.
- Handling diverse cargo types, including dry bulk, liquid bulk, and containers.
2. **Logistics:**
- Integrated logistics solutions encompassing inland container depots, warehousing, and transportation services.
- Ownership and operation of a private railway network to facilitate efficient cargo movement.
3. **Special Economic Zones (SEZ):**
- Development of industrial zones with robust infrastructure to promote trade and manufacturing activities.
- Notably, APSEZ developed India's first port-based SEZ at Mundra.
**Global Presence:**
Beyond its extensive operations in India, APSEZ has expanded internationally:
- **Haifa Port, Israel:** In 2023, APSEZ acquired a 70% stake in Haifa Port for $1.2 billion, enhancing its strategic footprint in the Middle East. (
- **Colombo Port, Sri Lanka:** APSEZ holds a 51% stake in a new terminal at Colombo Port, with operations expected to commence soon. (
**Financial Highlights:**
As of the fiscal year ending March 31, 2024, APSEZ reported:
- **Revenue:** ₹267.11 billion, a 28.10% increase from the previous year.
- **Net Income:** ₹81.11 billion, reflecting a 52.74% growth. (
**Recent Developments:**
In November 2024, APSEZ faced legal challenges when U.S. authorities indicted the company and key executives on charges of a $265 million bribery scheme to secure power supply contracts in India. The Adani Group has denied these allegations. ( (
Despite these challenges, APSEZ continues to play a pivotal role in India's maritime infrastructure, contributing significantly to the nation's trade and economic growth.

Adani Port now on BreakoutBuy Adani Port
TRG : 1470
Time before 14Feb2025
Some Point:
Market Volatility
Economic Conditions:
Fluctuations in the global economy can impact trade volumes and port operations, affecting revenue and share prices.
Stock Market Trends:
Broader market trends can lead to increased volatility in share prices, regardless of the company's performance.
Regulatory Risks
Government Policies:
Changes in government regulations regarding port operations, environmental standards, or tariffs can impact profitability.
Compliance Costs:
Increased scrutiny and compliance requirements may lead to higher operational costs.
Operational Risks
Infrastructure Challenges: Delays or issues in infrastructure development can hinder operational efficiency and growth prospects.
Supply Chain Disruptions:
Global supply chain issues, such as those experienced during the COVID-19 pandemic, can affect cargo volumes and revenue.
Competitive Landscape
Increased Competition:
The entry of new players or expansion of existing competitors in the logistics and port sector could impact market share.
Technological Advancements:
Failure to adapt to technological changes in logistics and shipping could put Adani Ports at a disadvantage.
Geopolitical Risks
International Relations:
Geopolitical tensions can disrupt trade routes and impact the flow of goods through ports.
Trade Agreements:
Changes in trade agreements or tariffs can affect the volume of imports and exports handled by the ports.
Financial Health
Debt Levels: High levels of debt can pose risks, especially if interest rates rise or if cash flows are adversely affected.
Profitability Concerns:
Any decline in profitability due to operational inefficiencies or increased costs can negatively impact share prices.
Investors should conduct thorough research and consider these risks alongside potential rewards when evaluating an investment in Adani Ports shares.

ADANI PORT AND SEZ LTD S/R Support and Resistance Levels:
Support Levels: These are price points (green line/shade) where a downward trend may be halted due to a concentration of buying interest. Imagine them as a safety net where buyers step in, preventing further decline.
Resistance Levels: Conversely, resistance levels (red line/shade) are where upward trends might stall due to increased selling interest. They act like a ceiling where sellers come in to push prices down.
Breakouts:
Bullish Breakout: When the price moves above resistance, it often indicates strong buying interest and the potential for a continued uptrend. Traders may view this as a signal to buy or hold.
Bearish Breakout: When the price falls below support, it can signal strong selling interest and the potential for a continued downtrend. Traders might see this as a cue to sell or avoid buying.
MA Ribbon (EMA 20, EMA 50, EMA 100, EMA 200) :
Above EMA: If the stock price is above the EMA, it suggests a potential uptrend or bullish momentum.
Below EMA: If the stock price is below the EMA, it indicates a potential downtrend or bearish momentum.
Trendline: A trendline is a straight line drawn on a chart to represent the general direction of a data point set.
Uptrend Line: Drawn by connecting the lows in an upward trend. Indicates that the price is moving higher over time. Acts as a support level, where prices tend to bounce upward.
Downtrend Line: Drawn by connecting the highs in a downward trend. Indicates that the price is moving lower over time. It acts as a resistance level, where prices tend to drop.
Disclaimer:
I am not a SEBI registered. The information provided here is for learning purposes only and should not be interpreted as financial advice. Consider the broader market context and consult with a qualified financial advisor before making investment decisions.

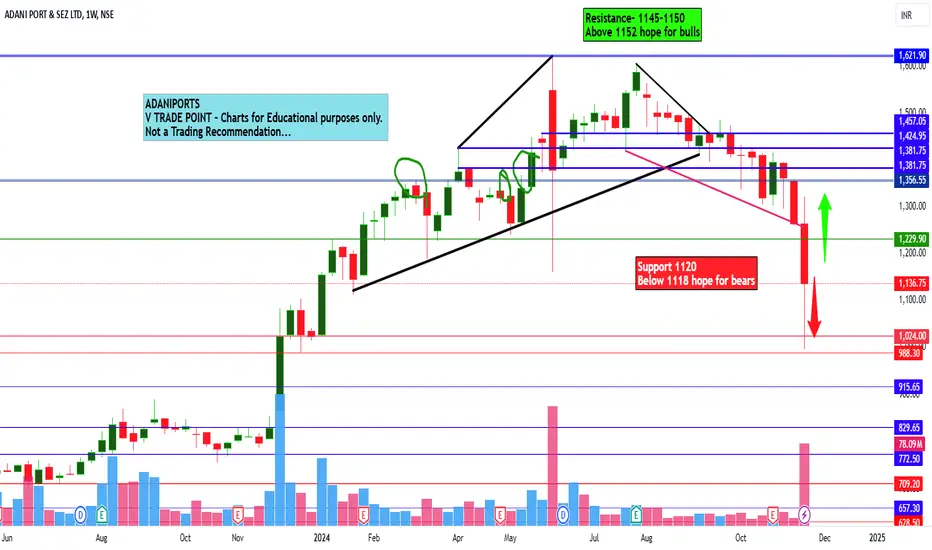
Adaniports view for Intraday 25th Nov #ADANIPORTS Adaniports view for Intraday 25th Nov #ADANIPORTS
Resistance 1145-1150 Watching above 1152 for upside movement...
Support area 1120 Below 1130 ignoring upside momentum for intraday
Support 1120 Watching below 1118 for downside movement...
Resistance area 1145-1150
Above 1130 ignoring downside move for intraday
Charts for Educational purposes only.
Please follow strict stop loss and risk reward if you follow the level.
Thanks,
V Trade Point
Fair value gap concept??The stock initially formed a dip, creating a rejection candle, signaling strong buying interest at lower levels. Following this, a subsequent candle confirmed robust rejection from the downside, indicating a potential reversal. The stock then experienced a sharp upward move.
After the price advanced by a certain percentage, the **Fair Value Gap (FVG)** concept became relevant, highlighting an imbalance in price action. Subsequently, a Fibonacci retracement analysis revealed a 50% correction from the recent high, aligning with a key technical level.
Following this retracement, the stock encountered a significant decline. However, it has now begun to recover, suggesting the potential for another move in the direction of the broader trend.

ADANI PORTS S/R for 4/10/24Support and Resistance Levels:
Support Levels: These are price points (green line/shade) where a downward trend may be halted due to a concentration of buying interest. Imagine them as a safety net where buyers step in, preventing further decline.
Resistance Levels: Conversely, resistance levels (red line/shade) are where upward trends might stall due to increased selling interest. They act like a ceiling where sellers come in to push prices down.
Breakouts:
Bullish Breakout: When the price moves above resistance, it often indicates strong buying interest and the potential for a continued uptrend. Traders may view this as a signal to buy or hold.
Bearish Breakout: When the price falls below support, it can signal strong selling interest and the potential for a continued downtrend. Traders might see this as a cue to sell or avoid buying.
20 EMA (Exponential Moving Average):
Above 20 EMA(50 EMA): If the stock price is above the 20 EMA, it suggests a potential uptrend or bullish momentum.
Below 20 EMA: If the stock price is below the 20 EMA, it indicates a potential downtrend or bearish momentum.
Trendline: A trendline is a straight line drawn on a chart to represent the general direction of a data point set.
Uptrend Line: Drawn by connecting the lows in an upward trend. Indicates that the price is moving higher over time. Acts as a support level, where prices tend to bounce upward.
Downtrend Line: Drawn by connecting the highs in a downward trend. Indicates that the price is moving lower over time. It acts as a resistance level, where prices tend to drop.
RSI: RSI readings greater than the 70 level are overbought territory, and RSI readings lower than the 30 level are considered oversold territory.
Combining RSI with Support and Resistance:
Support Level: This is a price level where a stock tends to find buying interest, preventing it from falling further. If RSI is showing an oversold condition (below 30) and the price is near or at a strong support level, it could be a good buy signal.
Resistance Level: This is a price level where a stock tends to find selling interest, preventing it from rising further. If RSI is showing an overbought condition (above 70) and the price is near or at a strong resistance level, it could be a signal to sell or short the asset.
Disclaimer:
I am not a SEBI registered. The information provided here is for learning purposes only and should not be interpreted as financial advice. Consider the broader market context and consult with a qualified financial advisor before making investment decisions.

Adaniports Ltd view for Intraday 12th September #ADANIPORTS Adaniports Ltd view for Intraday 12th September #ADANIPORTS
Buying may witness above 1453
Support area 1430. Below ignoring buying momentum for intraday
Selling may witness below 1411
Resistance area 1430
Above ignoring selling momentum for intraday
Charts for Educational purposes only.
Please follow strict stop loss and risk reward if you follow the level.
Thanks,
V Trade Point

ADANIPORTS SELL SIDE - FLAGAdani Port has formed a flag pattern on the sell side in the 30-minute chart, indicating a potential continuation of the downtrend. This bearish flag pattern suggests that the stock may experience a further decline in price, making it a sell signal for traders.

Adaniports view for Intraday 27th August#ADANIPORTS
Adaniports view for Intraday 27th August
Buying may witness above 1493
Support area 1475. Below ignoring buying momentum for intraday
Selling may witness below 1475
Resistance area 1493
Above ignoring selling momentum for intraday
Charts for Educational purposes only.
Please follow strict stop loss and risk reward if you follow the level.
Thanks,
V Trade Point

ADANI PORT & SEZ LTDSupport and Resistance Levels:
Support Levels: These are price points (green line/share) where a downward trend may be halted due to a concentration of buying interest. Imagine them as a safety net where buyers step in, preventing further decline.
Resistance Levels: Conversely, resistance levels (red line/shade) are where upward trends might stall due to increased selling interest. They act like a ceiling where sellers come in to push prices down.
Breakouts:
Bullish Breakout: When the price moves above resistance, it often indicates strong buying interest and the potential for a continued uptrend. Traders may view this as a signal to buy or hold.
Bearish Breakout: When the price falls below support, it can signal strong selling interest and the potential for a continued downtrend. Traders might see this as a cue to sell or avoid buying.
20 EMA (Exponential Moving Average):
Above 20 EMA: If the stock price is above the 20 EMA, it suggests a potential uptrend or bullish momentum.
Below 20 EMA: If the stock price is below the 20 EMA, it indicates a potential downtrend or bearish momentum.
Disclaimer:
I am not a SEBI registered. The information provided here is for learning purposes only and should not be interpreted as financial advice. It's important to remember that while these indicators can be useful, they are not foolproof. Always consider the broader market context and consult with a qualified financial advisor before making any investment decisions.

ADANIPORTS INR 1,587.85 TO 19,689 INR IN 12 YEAR FORWARDSGot bored today ! thinking of doing some analysis reports for Adani ports curiously He ha :)

Adani Ports Approaching Key Resistance Level
Adani Ports is nearing a crucial resistance at 1613.50.
Potential bullish breakout observed.
Strong uptrend sustained since October 2023.
Positive Q1 results could fuel further upward momentum.
RSI close to 70, indicating strength but approaching overbought territory.


