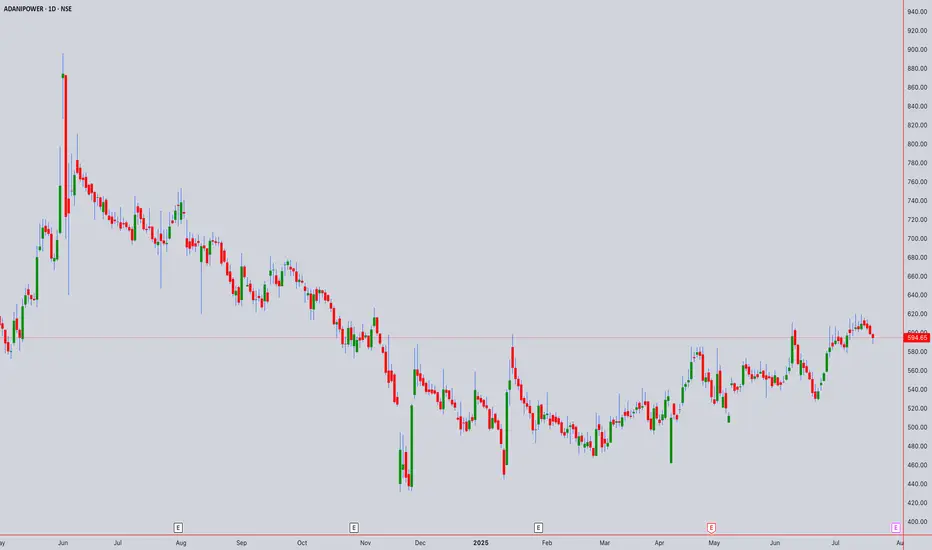
Adani Power (NSE:ADANIPOWER) Technical Analysis July 18th, 2025Current Price : ₹594.65 (as of July 18th, 2025, 02:00PM UTC+4)
Target Price: ₹633.67 (+6.56% upside potential)
Executive Summary
Adani Power is currently showing mixed signals across different timeframes. The stock has broken through key resistance levels but is facing overhead resistance. Multiple technical theories suggest a consolidation phase with potential for upward movement.
1. CANDLESTICK PATTERN ANALYSIS
Intraday Patterns (5M-1H)
Current Formation: Doji/Spinning top patterns indicating indecision
Key Pattern: Inside bar formations suggest consolidation
Volume Profile: Moderate volume with no significant breakout confirmation
Swing Patterns (4H-Weekly)
Primary Pattern: Rectangle/Channel formation identified
Support Zone: ₹513-520 (Strong support)
Resistance Zone: ₹588-600 (Current testing area)
2. HARMONIC PATTERN ANALYSIS
Potential Patterns
ABCD Pattern: Incomplete - monitoring for completion around ₹630-650 zone
Gartley Pattern: Potential bearish setup if rejection occurs at current levels
Fibonacci Levels:
Support: ₹450 (S1), ₹300 (S2), ₹200 (S3)
Resistance: ₹700 (R1), ₹850 (R2), ₹1,000 (R3)
3. ELLIOTT WAVE THEORY
Wave Count Analysis
Primary Wave: Currently in Wave 3 of a larger impulse structure
Sub-wave: Wave 4 correction potentially completing around ₹580-590
Target: Wave 5 projection towards ₹700-750 zone
Invalidation Level: Below ₹513 would negate current count
Time Cycles
Short-term: 5-8 day correction cycle
Medium-term: 21-34 day impulse cycle active
4. WYCKOFF THEORY ANALYSIS
Current Phase Assessment
Phase: Potential Mark-up Phase (Phase D-E transition)
Volume Analysis: Accumulation patterns visible on weekly charts
Smart Money: Institutional interest evident from volume profiles
Composite Operator: Testing supply around ₹600 levels
Key Levels
Spring Test: ₹513 level held as key support
Supply Line: ₹588-600 acting as resistance
Upthrust Potential: Break above ₹605 could trigger mark-up
5. W.D. GANN THEORY ANALYSIS
Square of Nine Analysis
Current Position: 594° on the wheel
Next Resistance: 625° (₹625) - significant Gann angle
Support Level: 576° (₹576) - 45-degree angle support
Cardinal Points: 600° represents a critical decision point
Time Theory
Natural Time Cycles: 90-day cycle completion expected by August 2025
Anniversary Dates: Historical significant dates align with current timeframe
Time Windows: July 25-30, 2025 represents important time cluster
Angle Theory
1x1 Angle: Currently trading above the 1x1 rising angle from ₹513 low
2x1 Angle: Resistance at ₹630 level (steep angle)
Price/Time Squares: Next square at ₹625 (25²)
Forecasting
Price Target: ₹625-650 based on geometric progressions
Time Target: 15-20 trading days for next significant move
Harmony Level: ₹594 is in harmony with previous swing levels
6. ICHIMOKU KINKO HYO ANALYSIS
Cloud (Kumo) Analysis
Current Position: Price trading above the cloud (bullish)
Cloud Thickness: Thin cloud ahead suggests easier breakout potential
Cloud Color: Green cloud in coming periods (bullish bias)
Line Analysis
Tenkan-sen (9): ₹587 - price above (bullish)
Kijun-sen (26): ₹571 - price above (strong bullish)
Chikou Span: Clear of price action (no interference)
Senkou Span A: ₹579 (support)
Senkou Span B: ₹562 (key support)
7. TECHNICAL INDICATORS
RSI Analysis
Current RSI: 58-62 range (neutral to slightly bullish)
Divergence: No major divergences detected
Overbought/Oversold: Not in extreme zones
Bollinger Bands
Position: Price in upper half of bands
Squeeze: Bands expanding, indicating increased volatility
Signal: Potential for continued upward movement
VWAP Analysis
Daily VWAP: ₹591 (price above - bullish)
Weekly VWAP: ₹584 (strong support)
Volume Profile: Heavy volume around ₹570-580 zone
Moving Averages
SMA 20: ₹583 (bullish crossover)
EMA 20: ₹586 (price above)
SMA 50: ₹567 (strong support)
EMA 50: ₹569 (upward sloping)
SMA 200: ₹524 (long-term bull market)
8. MULTI-TIMEFRAME ANALYSIS
Intraday Timeframes
5-Minute Chart
Trend: Sideways with bullish bias
Key Level: ₹592-596 range bound
Signal: Wait for breakout above ₹600
15-Minute Chart
Trend: Consolidating triangle pattern
Volume: Decreasing (typical in consolidation)
Target: ₹605-610 on upside breakout
30-Minute Chart
Trend: Higher highs and higher lows intact
Support: ₹590-592
Resistance: ₹598-602
1-Hour Chart
Trend: Bullish flag pattern forming
Breakout Level: Above ₹602
Target: ₹625-630
4-Hour Chart
Trend: Strong uptrend since ₹513 low
Pattern: Bull flag consolidation
Key Level: ₹588 as crucial support
Swing Timeframes
Daily Chart
Trend: Primary uptrend intact
Pattern: Rectangle between ₹513-588 broken upside
Target: Next resistance at ₹700 zone
Weekly Chart
Trend: Long-term bullish structure
Support: ₹450-500 major support zone
Resistance: ₹700-750 target area
Monthly Chart
Trend: Recovery from major lows
Long-term View: Potential for ₹850+ targets
Time Horizon: 6-12 months for major targets
9. FORECAST & OUTLOOK
Intraday Forecast (Next 1-5 Days)
Bias: Neutral to Bullish
Range: ₹585-610
Breakout Level: Above ₹605 for ₹625 target
Stop Loss: Below ₹582
Swing Forecast (Next 2-8 Weeks)
Primary Target: ₹633-650
Secondary Target: ₹700-720
Support Zone: ₹570-580
Risk Level: Medium (volatility expected)
Key Risk Factors
Overall market sentiment and Adani group developments
Earnings disappointment (recent -23.91% surprise noted)
Broader power sector dynamics
Regulatory changes in power sector
Trading Strategy Recommendations
For Intraday Traders
Buy: Above ₹602 with ₹610-615 target
Sell: Below ₹590 with ₹582-585 target
Risk Management: 1-2% position sizing
For Swing Traders
Accumulate: ₹580-590 zone
Target: ₹633-650 (first target)
Stop Loss: Below ₹570 (daily close basis)
Time Horizon: 4-8 weeks
Confluence Factors Supporting Bullish View
Multiple theories align for ₹625-650 targets
Strong volume accumulation patterns
Technical breakout from rectangle formation
Ichimoku cloud support
Gann squares and angles alignment
Warning Signals to Watch
Daily close below ₹580
RSI divergence formation
Volume decrease on any upward moves
Broader market weakness
Disclaimer: This analysis is for educational purposes only. Always consult with financial advisors and conduct your own research before making investment decisions. Past performance does not guarantee future results.
ADANIPOWER trade ideas
ADANI Power: From Buy to Sell and from Sell to BuyADANI Power: From Buy to Sell and from Sell to Buy. What a strange movement .
610 is a first resistance level to test.
( Not a Buy / Sell Recommendation
Do your own due diligence ,Market is subject to risks, This is my own view and for learning only .)

Adani PowerWeekly Chart
RSI above 60 D /W / M
Previous Inside Bar Candle 564
Cross swing High
Expected level All time High
Support 538

ADANI Power : Buy Triggered. Be mindful of a Red band resistanceADANI Power : Buy Triggered.
Be mindful of a Red band resistance
( Not a Buy / Sell Recommendation
Do your own due diligence ,Market is subject to risks, This is my own view and for learning only .)

Adani PowerMost stable Adani Stock devout of any drama.
has a low beta of 1.5
PER of 21
DY of 0.5%
Highest qtr Revenue of Rs 14200 cr
Qtr results were the worst in 3 years !
Annual income of Rs 10,000 cr
Technically in a 45% degree upslope since 2020
At CMP of Rs 550, it could just burst out to another level.
Has been on a consolidating mode for one year now.

ADANI POWER✅ Trade Setup
Parameter Value
Trade Direction BUY
Entry-1 ₹546
Stop Loss (SL) ₹417
Risk ₹129
Reward ₹462
Target ₹1008
Risk-Reward (RR) 3.6
Last Swing High ₹895
Last Swing Low ₹433
🧠 Logic & Key Takeaways
Trend Consistency: All timeframes from yearly to 60M are aligned in an uptrend, adding strong confluence to the buy setup.
Demand Zones: Multiple demand zones lie between ₹410–₹445, acting as a strong cushion. SL at ₹417 is just below key daily/weekly zones.
Entry vs ITF Demand: Entry at ₹546 is exactly in the intraday demand zone, providing a low-risk opportunity.
Target & RR: Ambitious target of ₹1008 aligns with macro bullish momentum. RR of 3.6 is excellent.
📌 Verdict:
✅ High-conviction BUY plan with full time-frame alignment and healthy risk-reward.
📍 Manage position sizing carefully due to the ₹129 risk and keep trailing SL as it breaks above ₹895.
🔍 Multi-Timeframe (MTF) & High Timeframe (HTF) Analysis Summary
Timeframe Trend Demand Zone Type Proximal Distal Avg
Yearly UP BUFL 167 132 150
Half-Yearly UP BUFL 432.5 432 432
Quarterly UP BUFL 432.5 410 421
Monthly UP Rally Rally 471 358 415
Weekly UP Rally Rally 410 380 395
Daily UP DMIP Support 454 417 436
Intraday (ITF 60-240m) UP BUFL 546 537 541.5
📊 Averages Overview
Timeframe Group Trend Avg Proximal Avg Distal Avg of Averages
HTF Avg UP 344 325 334
MTF Avg UP 445 385 415
ITF Avg UP 546 537 541.5
⚠️ Risks / Considerations
Entry at ₹546 is relatively high compared to MTF average (~₹415) — monitor closely for any breakdown below ₹537, which could invalidate short-term demand.
Strong reaction near last high ₹895 could slow momentum—watch for rejection near this zone.
Ensure volumes support the bullish breakout post-entry.

ADANI PORTS FOR YOU - Entry Initiated."Everything is pretty much explained in the picture itself.
I am Abhishek Srivastava | SEBI-Certified Research and Equity Derivative Analyst from Delhi with 4+ years of experience.
I focus on simplifying equity markets through technical analysis. On Trading View, I share easy-to-understand insights to help traders and investors make better decisions.
Kindly check my older shared stock results on my profile to make a firm decision to invest in this.
For any query kindly dm.
Thank you and invest wisely. "

ADANI POWER LTD S/RSupport and Resistance Levels:
Support Levels: These are price points (green line/shade) where a downward trend may be halted due to a concentration of buying interest. Imagine them as a safety net where buyers step in, preventing further decline.
Resistance Levels: Conversely, resistance levels (red line/shade) are where upward trends might stall due to increased selling interest. They act like a ceiling where sellers come in to push prices down.
Breakouts:
Bullish Breakout: When the price moves above resistance, it often indicates strong buying interest and the potential for a continued uptrend. Traders may view this as a signal to buy or hold.
Bearish Breakout: When the price falls below support, it can signal strong selling interest and the potential for a continued downtrend. Traders might see this as a cue to sell or avoid buying.
MA Ribbon (EMA 20, EMA 50, EMA 100, EMA 200) :
Above EMA: If the stock price is above the EMA, it suggests a potential uptrend or bullish momentum.
Below EMA: If the stock price is below the EMA, it indicates a potential downtrend or bearish momentum.
Trendline: A trendline is a straight line drawn on a chart to represent the general direction of a data point set.
Uptrend Line: Drawn by connecting the lows in an upward trend. Indicates that the price is moving higher over time. Acts as a support level, where prices tend to bounce upward.
Downtrend Line: Drawn by connecting the highs in a downward trend. Indicates that the price is moving lower over time. It acts as a resistance level, where prices tend to drop.
Disclaimer:
I am not a SEBI registered. The information provided here is for learning purposes only and should not be interpreted as financial advice. Consider the broader market context and consult with a qualified financial advisor before making investment decisions.

Short trade on Adani power in break from supportAdani Power: Weak momentum and bearish signals. Short-term bearish bias, potential targets: 510.50 and 450.30. Protect downside with a stop-loss above 532.00.
Key Points:
Clear and concise: The prompts are direct and easy to understand.
Engaging: They highlight the potential for a short-term bearish move.
Actionable: They provide clear entry points and stop-loss levels.
Risk management: The importance of a stop-loss is emphasized.
Remember: These are just trade ideas based on the provided chart. It's important to conduct your own research and analysis before making any investment decisions.

Adani Power at SupportThe strongest Adani Group company with sound financials and comfortably manageable debt along with sound current ratio.
Stock P/E - 14.8
ROCE 5Yr - 16.6 %
ROE 5Yr - 39.2 %
Debt to equity - 0.80
Current ratio - 1.60
The technical chart pattern suggest an entry.
Note: The idea is intended to spread awareness regarding the ratios that you should consider before investing and the chart reading done.
Any financial commitment will solely be your risk and should be done after thorough research.

Adani Power Ltd on Breakout Watch ➡️ Waiting for a bullish breakout above ₹680.85
📈 Next targets: ₹706.65, ₹752.35, ₹810.60, ₹895.35
⬇️ Strong support at ₹619.65

ADANI POWERADANI POWER – CMP 670.20 as on EOD 2 sep 2024
RSI breakout has taken place.
Stock has seen upsurge with sizeable volumes exactly from oversold region of RSI.
Same zone is also a good demand zone.
Now need to see if Adani power has the strength to cross the downward trendline and breach 700 levels to reach 740 / 800 / 870 levels and above.
Disclaimer –
I am not a SEBI REGISTERED person or analyst.
I am not responsible for anyone’s gains or losses.
I am doing this only to increase my knowledge and to learn.

Adani Power Limited Next Big Move.Adani Power Limited as price Broke out at Demand zone impulsively and Bullish Hidden divergence, Make sure to place your stops as depicted. Entry in lower TF when price approch Demand zone..

Adani Power Price Action PredictionAs my analysis NSE:ADANIPOWER is now ready to move for upside. Breakout of 30 mins candle will decide to take decision to take risk for buy side.
Note: This is my personal analysis, only to learn stock market behavior. Kindly do your own analysis/research to take any trade. Thanks & Regards


Adani Power looking more lucrative than Tata Power for shorttermTata power is stabilizing, so is Adani power.. But does it look like Adani power will reach its target price earlier?

ADANIPOWER LONGBeautiful Setup. Keep an eye on it.
Flag Pattern visible.
Breakout expected.
Good for Short Term.
Disclaimer : This is not a Buy or Sell recommendation. I am not SEBI Registered. Please consult your financial advisor before making any investments . This is for Educational purpose only.

Adani PowerStock for studay
2021 high break
volume growth
RSI above 60
EMA above 20/50/200
what support and expected level ?

MACD Crossover Swing Trade📊 Script: ADANIPOWER
📊 Sector: Power Generation & Distribution
📊 Industry: Power Generation And Supply
⏱️ C.M.P 📑💰- 628
🟢 Target 🎯🏆 - 668
⚠️ Stoploss ☠️🚫 - 611
📊 Script: HUDCO
📊 Sector: Finance
📊 Industry: Finance - Housing
⏱️ C.M.P 📑💰- 233
🟢 Target 🎯🏆 - 246
⚠️ Stoploss ☠️🚫 - 228
📊 Script: JSWINFRA
📊 Sector: Marine Port & Services
📊 Industry: Miscellaneous
⏱️ C.M.P 📑💰- 259
🟢 Target 🎯🏆 - 278
⚠️ Stoploss ☠️🚫 - 250
📊 Script: METROBRAND
📊 Sector: Leather
📊 Industry: Leather / Leather Products
⏱️ C.M.P 📑💰- 1081
🟢 Target 🎯🏆 - 1153
⚠️ Stoploss ☠️🚫 - 1044
📊 Script: HBLPOWER
📊 Sector: Auto Ancillaries
📊 Industry: Auto Ancillaries
⏱️ C.M.P 📑💰- 521
🟢 Target 🎯🏆 - 559
⚠️ Stoploss ☠️🚫 - 504
⚠️ Important: Always maintain your Risk & Reward Ratio.
✅Like and follow to never miss a new idea!✅
Disclaimer: I am not SEBI Registered Advisor. My posts are purely for training and educational purposes.
Eat🍜 Sleep😴 TradingView📈 Repeat 🔁
Happy learning with trading. Cheers!🥂

enter long between 297 -307 levelenter long between 297 -307 level stoploss 294...target ----326---347--- 357 ---------------376

ADANI POWER - Swing TRADE IdeaThe stock is in uptrend in all Higher time frames.
The stock has been in good consolidation for 12 weeks.
Downside wicks in the last 3 weeks indicate good buying coming in.
The last week candle seems to be an indecision candle post diminishing selling pressure and buying stepping in.
The lower time frame price actions such as Daily and 75 mins confirm the upside price momentum.
My SL and targets as mentioned in chart. I would plan a wide SL of 12% and target of 22% trailing. Target 1 - 591 ALL Time high.

Bullish on ADANI POWERStrong chart + solid fundamentals = rally
Buy @ CMP
Stoploss @ 20%
1st Target @ 50%

Adani powerbreakout happend in adani power.
This is for educational purpose, do your own research before investing
