ANGELONE cmp 2720.Angelone is a strong fundamentaly strong stock currently trading at fair valuation with the PE of 18.Dividend yield- around 1.5%. ROCE-38% and ROE- 43%.For long term players this is a best GEM. After making a Sharp rally in Jan 2024 it is concolidaing till now. And now it giving a signal for going bottom out and forming a rounding bottom Pattern. Study its chart and find your Best risk reward and entry exit Area.Thank you.
ANGELONE trade ideas

SWING IDEA - ANGELONENSE:ANGELONE 's stock price has been retesting around the 2000 resistance level for approximately two and half years. Following multiple retest, the stock finally broke out above this level in October 2023 and has since established it as a key support.
The stock subsequently surged to a peak of 3895, representing a 87% increase. However, it then experienced a sharp correction, plummeting 45% to revisit the 2000 support level again. This pivotal point, formerly a resistance, has now become a robust support.
Currently, ANGELONE is exhibiting an upward momentum, poised to retest its swing high at 3895. The weekly MACD crossover, occurring after the establishment of support at 2000, indicates a bullish trend reversal.
KEY OBSERVATIONS:
- Two-year resistance level of 2000 broken in October 2023
- Stock surged 87% to 3895 before correcting 45%
- 2000 level now serves as robust support
- Weekly MACD crossover indicates bullish momentum
- Upward momentum poised to retest swing high at 3895
RECOMMENDATION:
Based on this technical analysis, I would recommend holding ANGELONE for a Long Term horizon. This could potentially yield:
- 35% returns from the current price (as of writing)
- 87% returns from the support point (2000)
This analysis highlights a compelling buying opportunity in ANGELONE, driven by its breakout and momentum reversal.
IMPORTANT NOTE: Investors should be aware that there is a possibility that the stock may revisit this Support level at 2000 in the near future before resuming its upward momentum towards the swing high at 3895. This potential pullback should be monitored closely, and investors may consider adjusting their strategies accordingly.
DISCLAIMER: This IDEA is for informational/educational purposes only and should not be considered as investment advice. The analysis presented is based on technical indicators and historical data but does not guarantee future performance. Please conduct thorough research based on financial goals and risk tolerance, and consult with a financial advisor before making any investment decisions.

Is Angel One going back for its ath?cmp: 2552
personally holding so my view is biased .
closing above 2700 is crucial for 3200+ targets.
NOTE : JUST FOR EDUCATIONAL PURPOSES.
Market Cap ₹ 23,028 Cr.
Current Price ₹ 2,552
Stock P/E 19.2

Angel one formed Reverse Head & Shoulder Pattern on Daily chartAfter a decent correction Angle one formed Reverse Head & Shoulder Pattern , It's a reversal pattern. Target on basis of this pattern will be 2950 & 3400, With a stoploss off 2450
It's not a buy or sell recommendations,For education purpose only .

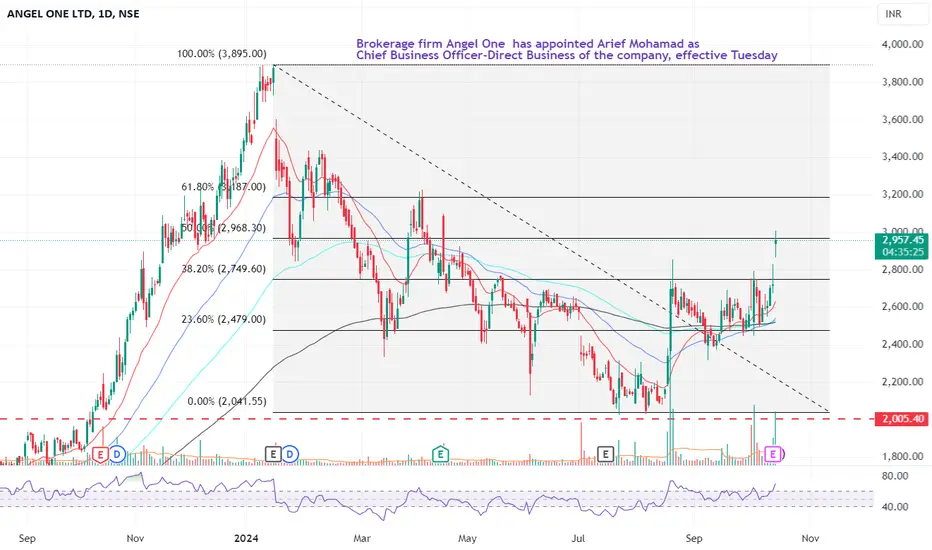
Angel One Breaking Key Resistance Level Amid Leadership ChangeAngel One Ltd (NSE: ANGELONE) has witnessed a sharp upward movement, with today’s price action breaking past the key Fibonacci retracement level of ₹2,968 (61.8%) after bouncing off the support near ₹2,600. The recent appointment of Arief Mohamad as the Chief Business Officer - Direct Business could be a key factor boosting investor confidence, triggering this strong bullish momentum.
Key observations:
The stock is trading above its 20-day, 50-day, and 200-day moving averages , indicating strong bullish sentiment.
Immediate resistance is seen around ₹3,187 (next Fibonacci level) , while strong support rests at ₹2,749 (38.2% retracement level).
RSI is hovering near 70, showing an overbought condition. A pullback may be expected, but if momentum continues, a breakout toward ₹3,400 is possible.
This move shows the potential for further upside, though caution is advised with the RSI entering overbought territory. Traders might want to watch closely for a potential pullback or consolidation in the near term.
Angel One chart analysisAngel One chart analysis on daily time frame. This stock is at resistance level.
Please follow for more such charts.


Angelone !! extremely bullishAs per the chart pattern there are two big targets possible
1) All time high
2) Size of Rounding bottom if we add on All time high

Angelone: looking trend reversal pattern. swing trading-20%Recently co. Considered some charges are applicable on delivery of shares. Earlier it was free.
Which is positive for co.
Technically looking bullish setup. All technical are mentioned on chart. Pls go throughly to understand the price action.

ANGELONE NSE FLAG & POLE WTF/MTF 45W Bull Run/ PositionalANGELONE Analysis Price Action/FIBO
TRADE PLAN
ENTRY -2750 25%Qty, 2850 50%+ Qty Add Progressively
SL -2500 Weekly Low Close Price
TARGET --01-3200 , TGT02-3450 TGT3-5200 (F&P height above the flag BO)
Hold For a 2Years or TGT 2/3
Chart Pattern :
STOCK has recently done a 10Month Bullish Impulse and Retraced to 61% Forming a FLAG & POLE, Bouncing above the 50% FIBO /R level and consolidating in a range, WYCKOFF Accumulation. Strong Support at 2380 Lvl.
INDICATORS EMA :
The Price is Currently Trading below 200EMA, and 20EM crossed above 50 & 200 EMA in DTF.
50EMA is in a Upturn and close to crossing the 200EMA.
FIBO E :
After the Bounce-back from 61% FIBO Retracement Level, Price is currently holding above 50% FIBO/R level and trading near the 38.6% FIBO Retracement level on DTF. Early Impulse uptrend with ChoCH at 2700 on DTF
Volumes: Volumes are trading above the 20VMA in WTF..
Keep in your Priority Watch List
Disclaimer: For Education/Reference Purpose Only, Trade at your Own Risk with correct position sizing and SL based on your Risk apetite (Exit when price closes 7to8% below your Entry).
Trail Your SL progressively. Learn/Know and Review the Stock trading Technical Terminology. Check Verify the Financial fundamentals of the Stock and Seek Advice from a Certified Financial Advisor prior to Investing. Prefer Entry with 25% quantity, Add in Tranches of 25%-50% as prices moves upwards recommended.
MTFA- Multiple Time Frame Analysis
DTF -Daily Time Frame
WTF-Weekly Time Frame
MTF- Monthly Time Frame
ATH-All Time High
RBC&H-Rounding Bottom Cup/Handle
BO- Breakout Close
EMA -Exponential Moving Average
FIBO R/E -Trend based Fibonacci Retracement/Extension
SL Stop Loss
TBD- To be Decided
CHoCH- Change of Character Bullish/Bearish
MSB/BOS -Break Out Structure
FVG Fair Value Gap
20VMA -20Volume Moving Average
SWING/POSITIONAL Trade

Angel one this stock ready for breakout Angel one reday for breakout in weekly chart.This stock of change the price action chart.

angel onesigned up 900,000 new clients in August, up 22.9% year over year, according to an Indian bourse filing on Friday.
The brokerage services company's client base during the month reached 26.7 million, an increase of 62.9% from 16.4 million a year ago.


ANGEL ONE LTD S/RSupport and Resistance Levels:
Support Levels: These are price points (green line/shade) where a downward trend may be halted due to a concentration of buying interest. Imagine them as a safety net where buyers step in, preventing further decline.
Resistance Levels: Conversely, resistance levels (red line/shade) are where upward trends might stall due to increased selling interest. They act like a ceiling where sellers come in to push prices down.
Breakouts:
Bullish Breakout: When the price moves above resistance, it often indicates strong buying interest and the potential for a continued uptrend. Traders may view this as a signal to buy or hold.
Bearish Breakout: When the price falls below support, it can signal strong selling interest and the potential for a continued downtrend. Traders might see this as a cue to sell or avoid buying.
20 EMA (Exponential Moving Average):
Above 20 EMA: If the stock price is above the 20 EMA, it suggests a potential uptrend or bullish momentum.
Below 20 EMA: If the stock price is below the 20 EMA, it indicates a potential downtrend or bearish momentum.
Trendline: A trendline is a straight line drawn on a chart to represent the general direction of a data point set.
Uptrend Line: Drawn by connecting the lows in an upward trend. Indicates that the price is moving higher over time. Acts as a support level, where prices tend to bounce upward.
Downtrend Line: Drawn by connecting the highs in a downward trend. Indicates that the price is moving lower over time. It acts as a resistance level, where prices tend to drop.
RSI: RSI readings greater than the 70 level are overbought territory, and RSI readings lower than the 30 level are considered oversold territory.
Combining RSI with Support and Resistance:
Support Level: This is a price level where a stock tends to find buying interest, preventing it from falling further. If RSI is showing an oversold condition (below 30) and the price is near or at a strong support level, it could be a good buy signal.
Resistance Level: This is a price level where a stock tends to find selling interest, preventing it from rising further. If RSI is showing an overbought condition (above 70) and the price is near or at a strong resistance level, it could be a signal to sell or short the asset.
Disclaimer:
I am not a SEBI registered. The information provided here is for learning purposes only and should not be interpreted as financial advice. Consider the broader market context and consult with a qualified financial advisor before making investment decisions.

Opportunity to "ADD ON" Dips in AngelOneAngel One could fall till 1600-1700 levels, where there is strong support.
Looks like its facing resistance as of now.
One's looking to open position in Angel One can wait for a bit and the one's holding can add till 1600-1700 levels.

ANGELONE - Breakout and Bull FlagANGELONE has broken out of a falling wedge and is now forming a bull flag, indicating strong bullish momentum ahead.

ANGEL ONE LONGQtrly Demand BUFL - bullish Flag out Zone 1965
Monthly Demand BUFL - bullish Flag out Zone 1965
Weekly Demand BUFL - bullish Flag out Zone 1965

Good BuyShare NAME :- Angel One
CMP-2619
BUY RANGE:-2600-2650
TARGET:-2900++
LONG TERM TARGET :-3200++

Good BuyShare NAME :- Angel One
CMP-2619
BUY RANGE:-2600-2650
TARGET:-2900++
LONG TERM TARGET :-3200++

Angel One - Probable 5th Wave.Angel One - Taking Support at Monthly Breakout + Probable 5th Waves (Impulsive)
On Applying Fibonacci Extension 1.618 levels can be target

Angelone chart analysisAngelone chart analysis on weekly timeframe. Please share your valuable feedback.
Breakout and retest done.

ANGLEONE
ANGELONE LTD has took support from major level TGT is almost ATH
This is just for educational purpose

Angel One - 61.8% retracement. BuyAngel One at 61.8% retracement of entire prior move
Good risk reward in going long here
Stock cheap at 12-13X Fy26 earnings
