ASHOKLEY trade ideas
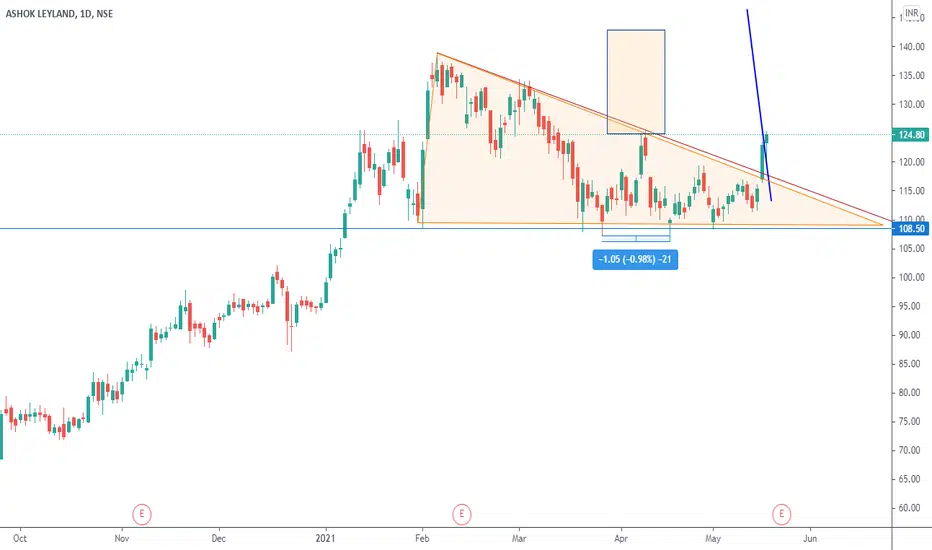

Broken Symmetrical TriangleStock Analysis : Ashok Leyland has broken the sym triangle it is good to buy around on retest level on broken supply zone for the target given on the chart.
Let's see..


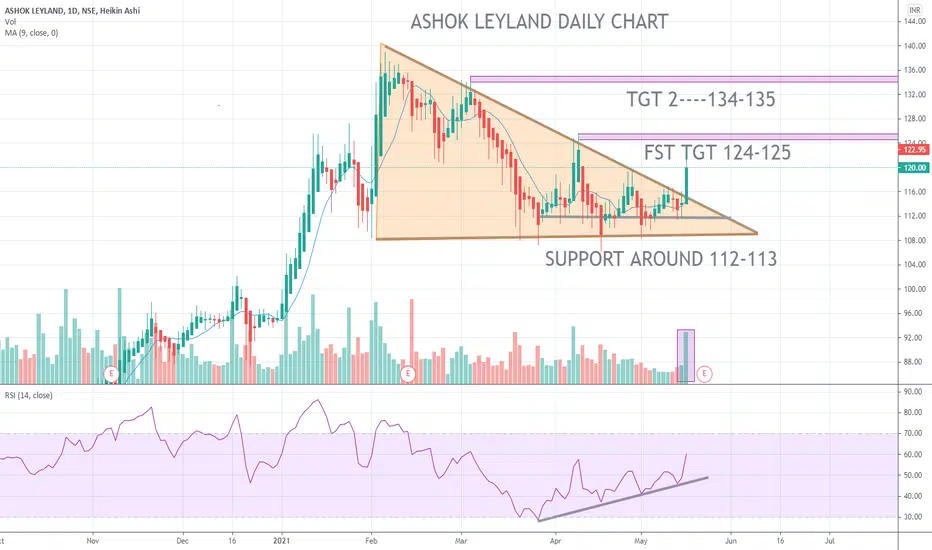
ASHOKLEY looking good for long positionGood breakout with volume...looking good at CMP 122.95...SL Below 105 DCB


Ashokleyland LongM and W RSI above 60
Bull flag breakout on weekly time frame.
Auto Sector performance improving on a Relative Basis compared to the Broad Market
Enter @ CMP
Initial Stop Loss: 116
Trailing stops with SuperTrend or Adaptive ATR
XXXXXXXXXXXXXXXXXXXXXXXXXXXXXXXXXXXXXXXXXXXXXXXXXXXXXXXXXXXXXXXXXXXXXXXXXXXXXXXXXXXXXXXXXXXXXXXXXXXXXXXXXXXXXXXXXXXXXXXXXXXXXXXXXXXX
Risk Disclosure
DISCLAIMER: Futures , stocks and options trading involves substantial risk of loss and is not suitable for every investor. The valuation of futures , stocks and options may fluctuate, and, as a result, clients may lose more than their original investment. The impact of seasonal and geopolitical events is already factored into market prices. The highly leveraged nature of futures trading means that small market movements will have a great impact on your trading account and this can work against you, leading to large losses or can work for you, leading to large gains.
If the market moves against you, you may sustain a total loss greater than the amount you deposited into your account. You are responsible for all the risks and financial resources you use and for the chosen trading system. You should not engage in trading unless you fully understand the nature of the transactions you are entering into and the extent of your exposure to loss. If you do not fully understand these risks you must seek independent advice from your financial advisor.
All trading strategies are used at your own risk.

ASHOK LEYLANDBuy-115-110
SL-107 Below Closing Basis
Target-125-135-145
Time Frame-1-2 Months
Auto Sector Will Boom As The Decline In Covid Cases & Markets Are Looking Towards The Reopening..

ASHOK LEYLAND BREAKOUT - BULLISHLONG - ASHOK LEYLAND
Target as per the height of triangle - 145+
confirm it with MACD and MVA 9 and 20 crossover
Bullish movement for a further week expected
SL at 110

ASHOKLEY is ready to fly !!!??ASHOKLEY : Formed descending triangle. Seems like it is ready to fly up!


ASHOKLEY SHORT {Head and shoulders chart pattern breakout}Ashokley Short
Sell=126.20
SL=136.45
TG= 106


Ashok leyland showing a nice wave structureAshok leyland is showing a very nice wave formation at current level it looks like we have completed wave A and heading for wave B which has 3 wave in it and two waves already over and now we are heading for the third wave which is trade able for a very short target of 127 but if the whole ABC correction is over than we are heading for bigger Wave 3 which can extend to 270-80 levels from current level which will be a great trading opportunity above the down trend line coming from top of wave 5 of 1

WAVE 3 - ASHOK LEYLANAfter completion of wave 2, Ashok Leyland is into Wave 3. Price is expected to reach 180 from current levels.

