THIRTY MINS MAGIC in AshokLeyland After a huge drop in recent months Ashok Leyland takes a reversal and it already started its upmove , get ready folks
ASHOKLEY trade ideas


Long term bet - ashok leylandAshok leyland has been falling like a knife, without much bounces, but a very big support is seen nearby 74 odd levels, one can look to buy there. will update once the actual level of 74 is reached. Will have to look at the price action from there to understand if it can be kept for long term or short term only.

Perfect Elliot Wave In Ashok Leyland (Probability 2)We're in the correction waves of Elliot with a perfect head and shoulders at the end of impulse. Another head and shoulders is seen in making which also completes the corrective waves. (Fundamentally company is cool, this is just the mood of investors captured by the Great Elliot

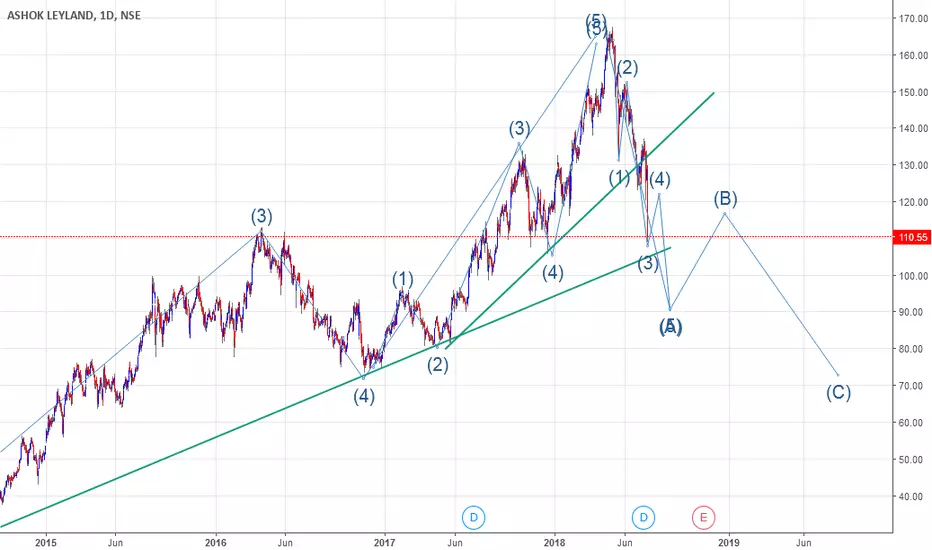
Perfect Elliot Wave In Ashok Leyland (Probability 1)We're in the correction stage of the long term elliot wave in Ashok leyland. Perfect head and shoulders seen at the end of Elliot's impulse wave.
Hence there can be two possibilities according to elliot wave (there can be more, is pointed two most probable) and this is Probability 1

Ashokley Long RSI, MACD and Stochastic showing potential divergence and Bullish Engulfing candle also hinting of short term bullish momentum building. Buying above 104.50 stoploss at low of engulfing candle 50EMA i take as first target, Lets see what happens.

ASHOK LEYLAND - WEAK STRUCTURE#ASHOKLEYLAND
CMP 102.9
Bias - Bearish SUBJECT TO BREAKDOWN OF 100 LEVELS.
Weekly chart shows a perfect H & S pattern.
Price at the neckline region with higher probability of breakdown.
Breakdown of 100 possibly could be disaster for the stock.
Pivot based ema oscillator is at a new 2 year low.
Next major support seen in the region of 80-82. Camarilla S4 at 88.
View negated if price crosses above 112.


NSE:ASHOKLEY Sell For 27 Nov 2018NSE:ASHOKLEY sell initiate for 27 Nov 2018 using 1 hour chart based on Fibonacci levels,
check below Sell level :
Sell Below : 108.55
Stop Loss : 110.55
Target : 106.7

Ashok Leyland Beginning of downtrend.Unless we get some great news here, this stock is gonna go in a long downtrend if we break the neckline/support at 105.5.
1) Head and Shoulder signalling trend reversal from bullish to bearish.
2) Descending triangle signalling bearish pattern.
My previous idea had a target of 116-118, which we might not reach. I am going to close my long trades here and will open positions only if we break out of the triangle.

I am seeing a good R/R hereBounced off the current levels four times before making it a strong support, in a short term downtrend forming a descending triangle. Could see narrow range in the coming few days before it breaks out of the triangle. I would place my buy here and next buy at 100. A huge upside potential, a break upward from the triangle could start a new rally and we could see 20-25% gains, or more. The risk to the downside is low. The volume is extremely good. Traded in a narrow range with a huge volume today, so that's a good amount of accumulation
You could place your buy here or wait for the break out from the triangle. I have opened long positions at 105.8


Short ashokleyIt has given breakout on daily Chart, macd rsi and Bollinger band also giving short signal


ASHOKLEY Breakout possible. After a long downtrend and following consolidation, the stock now has shown a positive momentum but somehow is rangebound, any price movement above 135 will take it to 140 -145 in a short term rally. Buy above 135 with target 140 - 145 and stoploss 130.

Ashok Layland Short Term BearishThe last wave v=V=3 is completed.
Internal counts are also given.
Now it is correcting for 4th wave.
At present wave a of 4 is completed and b is running up
and wave c will start soon to reach up to 100 -110


AshokLey, 200 DMAI covered this stock consistently several weeks back. Now price has come down to a level which meets certain technical criteria. 200 DMA decides the future course of a stock. If this level is respected, intermediate target can be 151. So risk to reward ratio is attractive.

AshokLeylandCount the profit, anyone there please!!! Now 119-118 can be the target provided 200 DMA that is 128 does not work as a speed breaker. Jay Ho!!

