LEYASHOKSSTOCKConsolidating here after making a new high after years, should jump higher from here .
ASHOKLEY trade ideas

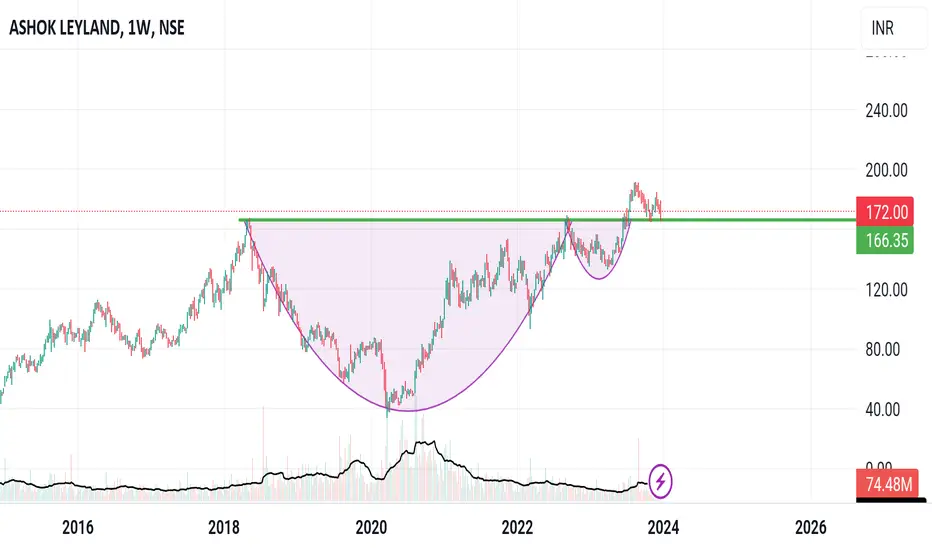
Cup and handle breakout in Ashokley NSE in weekly It's a good breakout and formed cup and handle pattern in weekly timeframe. Price is still neckline and formed double bottom near support line. It's good for investing and swing trade. Good to buy now. It's only my view not a recommendation.
Ashok Leyland Aggressive Trade-> Ashok Leyland is making an inverse head and shoulder pattern at 1D at demand zone which also confluences with trendline support
-> Conservative entry only after this pattern is broken at 1D timeframe
-> For aggressive entry, there is another inverse head and shoulder pattern at 1H, we can go long after that is broken
-> It is a classic case of a pattern inside another pattern.

Ashok Leland is forming a bullish pattern Ashok Leland has doubled profits from last year and is forming an interesting bullish pattern.

ASHOKLEY for longsASHOKLEY touched Buy Zone, small stop loss 141 levels, we can plan for longs, ASHOKLEY can touch 153/167 levels in short term


Driving to 190I have presented my charts here. Entry at 176 seems sufficient. Volume is promising.
No buy sell recommendation. NSE:ASHOKLEY

ASHOK LAYLAND Swing Levels NSE:ASHOKLEY Swing Levels
Wizard Levels/Zones
>Hey buddy, Wait for the price to close above or below-mentioned zones. Once the price closes above or below, SUPPORT becomes RESISTANCE and RESISTANCE becomes SUPPORT.
> If you're following these zones then kindly follow the rules too. Risk management, and Position sizing.
> This is my perception of the market so, kindly do your analysis to get more clarity on the market.
> These levels might help you guys. As per my view, I'm sharing it with you guys.
> This is not a blueprint to happen, so kindly do your own analysis and my view. Thank you for your SUPPORT

ASHOKLEYLAND Levels for LONG-TERM NSE:ASHOKLEY IPS Levels for LONG TERM
Wizard Levels/Zones
>Hey buddy, Wait for the price to close above or below-mentioned zones. Once the price closes above or below, SUPPORT becomes RESISTANCE and RESISTANCE becomes SUPPORT.
> If you're following these zones then kindly follow the rules too. Risk management, and Position sizing.
> This is my perception of the market so, kindly do your analysis to get more clarity on the market.
> These levels might help you guys. As per my view, I'm sharing it with you guys.
> This is not a blueprint to happen, so kindly do your own analysis and my view. Thank you for your SUPPORT

A perfect Midcap stock for samvat 2080**IT IS A LONGTERM IDEA**
Follow the FIVE rules below 👇
1)Book whole profit at TP if u want to free up capital.
2)Stoploss is when deathcross happened 3)Stick to strict stoploss exit when hit.
4)Wait as long as it hits TP 🎯.
5)Keep your capital allocation at your own risk(adv:not more than 10% of available cash)
**CHART IS SELF EXPLANATORY**

Ashok Leyand Ashok Leyand share Elliot Wave Analysis
This stock start first wave 1999 price 1.45 end this wave 2010 price 40 or wave second start down side 2010 to 2013 price come down 40 to 12 and again upside move start wave 3 12 ruppes price to 174 price end and again price come down 170 to 34 price

ASHOKLEYWeekly Breakout and retested, Previous swing low is stop loss (132.40) and fib level 1.618 is target (247.80)

Ashok Leyland Entry - above 184
Tgt - 211
Timeframe - 30-45 days
-- DISCLAIMER --
I am not a financial advisor or SEBI registered
This is just a view
Please DO YOUR OWN RESEARCH before investing in any stock
Happy trading
Peace

ASHOK LEYLAND: Trading near supportASHOK LEYLAND: Trading near support.
I think it is good time to add it in portfolio

ASHOK LEYLAND Stock in lower low, lower high formation.
Price breaks DEMA
Macd not indicate clearly move
RSI Bearish
Go for short 164 Target with small stoploss
RR very good
Disclaimer This is my personal view for education purpose only
No Buy sell recommendations.

Ashok Leyland looks GOODAshok Leyland gave a powerful ATH breakout, trend is good as price making higher highs and higher lows, currently price retesting its breakout level on weekly TF.
If market conditions stays supportive, it can give an impressive bullish move.

Ashok Leyland Swing SetupPrice has broke out of a cup with handle pattern and has retested the support.
Good to enter at CMP with its technical target at 300 and SL at 162.
Around 70% ROI in medium term with 9:1 R:R.
Robust fundamentals.
Do your own due diligence before taking any action.
Peace!!

Ashok Leyand share elliot wave analysisAshok leyand daily time frame stock move upside 5th wave . some time before ashok leyand complete 4 th wave descending triangle

Ashok LeylandAshok Leyland has broken Cup & Handle pattern .
It looks bullish on weekly time frame.
Good entry point if it retest neckline.
It is not a recommendations, do your own research before entering in any stock.

ASHOKLEY, breakout soonAshokley can soon touch 200+ once gives closing above 192.
Momentum trader should wait for 192++
While value investor and swing trader can buy every dip.
The auto sector has shown bullishness but Ashok has yet to contribute in the rally.
Disclaimer: just an educational advice not a buy or sell.

Ashok Leyland bounce from supportAshok Leyland now in uptrend confirmed by a downtrend indecision DOJI on 14th september but has to cross 187 look for resistance trendline

Strong Strength Buy SignalWe can see a strong sentiment in Ashok Leyland Nifty Auto is down today but Ashok Leyland tested its previous resistance and took support today and climbed up with good move I think the stock will test its resistant at 156 in upcoming days as the stock is in the bullish momentum from past few days. Ashok Leyland might even go up above 156 if it breaks and takes support at 156. In live market I can see a hammer pattern formation till now made by the stock with high wick at the bottom that shows buying from lower level.
Write me if any modification in the analysis and do write me your view on this analysis.
Also please consult your financial advisor before investing

ASHOK LEYLAND make a bearish marubozu candle on chart
Also break 20 DEMA
Break nackline.
Macd give signal bearish crossover.
Good risk reward for short position trade.
Disclaimer:- this is my personal view for education purpose only.
No Buy sell recommendations give by me.
