ASHOKLEY trade ideas

Cup & handle breakout in Ashok leylandBreakout of long term resistance with a handle of Cup formation suggesting big targets for ashok Leyland ... likely to see a multi bagger from here ... target equals depth of the cup which comes out to be around 833

Ashok leyland close above 167 can give a big movementAshok leyland close above 167 can give a big movement
25-30% upside possible, if daily close is above 167
time frame - by jan'23

ASHOKLEY
The stock has given a breakout above its resistance given by the May 2018 all time high of 167.
The Monthly RSI has still not touched its Overbought zone.
In the past, a breakout above all time high has given a minimum test of 161.8% FR Level, so stock could see at least 250. Optimistic long term target is at 600 (423.6% FR Level).
Bullish view remains intact as long as price survive 165!

ASHOK LEYLAND RANGE BOUND CONSOLIDATIONCurrently Ashok Leyland is consolidating in a range (178.5 - 185.5) Breakout of the range will give a good movement...
In case of Bullish Breakout
TP1 - 190
TP2 - 195
TP3 - 200
In case of Bearish Breakout
TP - 175

ASHOKLEYNSE:ASHOKLEY
One Can Enter Now ! Or Wait for Retest of the Trendline (BO) Or wait For better R:R ratio
Note :
1.One Can Go long with a Strict SL below the Trendline or Swing Low of Daily Candle.
2. Close, should be good and Clean.
3. R:R ratio should be 1 :2 minimum
4. Plan as per your RISK appetite
Disclaimer : You are responsible for your Profits and loss, Shared for Educational purpose

ASHOKLEY- A 5 YRS OLD cup BREAKOUT. WITH SMALL SL.A 5 YEARS OLD BREAKOUT HAS taken place at the ashokley,
a small sl and huge risk to reward can been seen, if entered with a pullback

AshokleyAshokley Chart Analysis.........31/07/23
A correction wave ABC is forming on Ashokley chart whose first target is 174 and final target is 168. We have taken a short position from 186 level to 190 stop-loss.
Enjoy !

Ashok Leyland Bags INR8 Billion Order from Indian ArmyAshok Leyland NSE:ASHOKLEY secured an order worth 8 billion Indian rupees from the Indian Army, according to a Monday release.
Recently, NSE:ASHOKLEY traded close to a recent supply zone, and today's last candle had a significant amount of volume.
It is anticipated that NSE:ASHOKLEY will start the day with a gap up zone and touch the levels of 175.60 as target1 and 179.20 as target2.
NOT A TRADE RECOMMENDATION
ONLY FOR EDUCATIONAL PURPOSE

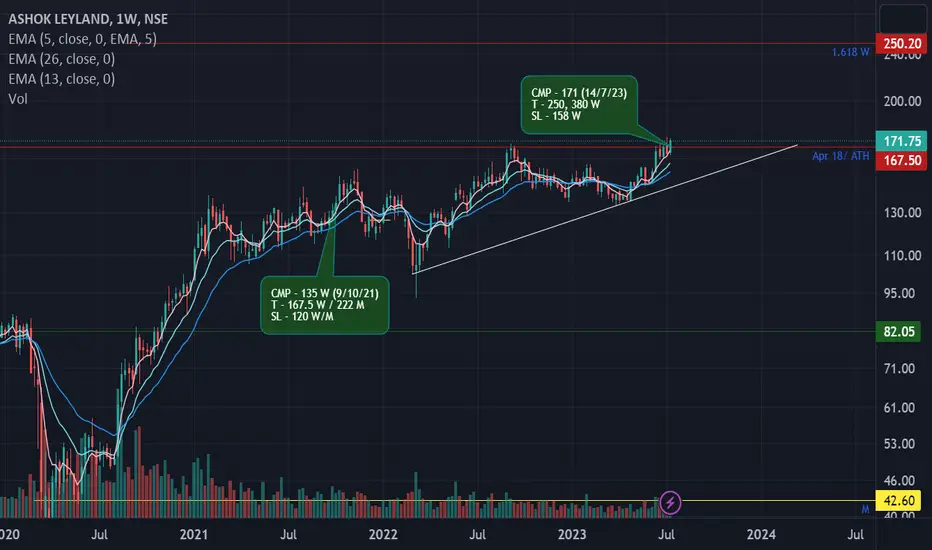
Investment pick of the week!Ashok Layland made its previous high on April 18. After 5 years of consolidation and after testing the resistance multiple times it has finally given breakout. Now the stock will trade under blue sky so there will be no possible upper limit. This is the right time to invest in the stock as Layland is the third best company when it comes to bus production. The stop loss given here is for the traders. An investors should keep a deep stop loss of 130 or even more on weekly closing basis.
CMP - 171 (14/7/23)
T - 250, 380 W
SL - 158 W

Ashok LeylandNow is the opportune moment to consider Ashok Leyland. The situation appears promising in various aspects, such as trading volumes and the monthly candle closing above a significant Gann box level. Additionally, Ashok Leyland has already entered a new Fann angle.

ASHOK Leyland Make ascending triangle chart pattern in daily time fram , 50 EMA cross 100 EMA from below that's bullish Sign , price is at 52 week high take break out at resistance level and make retest at same level so first Target will be 185.75 and stop loss will be 146.95
This is for educational purpose not a trading advice so that's my view comment down your view 🤗

ASHOKLEYNSE:ASHOKLEY
One Can Enter Now ! Or Wait for Retest of the Trendline (BO) Or wait For better R:R ratio
Note :
1.One Can Go long with a Strict SL below the Trendline or Swing Low of Daily Candle.
2. Close, should be good and Clean.
3. R:R ratio should be 1 :2 minimum
4. Plan as per your RISK appetite
Disclaimer : You are responsible for your Profits and loss, Shared for Educational purpose

Ashok Leyland, Positional Trade Idea.Ashok Leyland has created a cup and handle formation on weekly charts, which would be validated if price crosses 175 with good volumes. Keeping a stoploss of previous swing low, it can be a good postional trade setup. That said, it is always a great idea to trail your profits using moving averages or ATR or any trend following indicator.

harmonic pattern formed in Ashok leylandharmonic pattern formed in Ashok leyland, target defined in the chart
ABCD pattern also formed

Ashok Leyland at ATHAshok Leyland trading at ATH, we can see quick upmove of 10-15% from CMP.
Buy at CMP upto 170
Target - 185-200
SL- 160

Ashok LeylandI am in love with this chart. Ashok Leyland since listing in 1999 is in a clear uptrend. The bottom trend is always a definite buy!
Now Ashokley is on the verge of break out, closing above 168rs is a buy idea. Target is the top uptrendline , I suppose it will be around 260-270rs. SL closing below 168rs. The risk (almost no risk) to reward is 1:100

Cup & holder breakout | Ashok leylandAfter a several failed attempts to hold above 160, finally ashok leyland seem like to break it most important resistant zone of 168. In the event the stock will likely to reach above 220 levels in mid term

Major breakout in ashok Leyland On monthly chart of ashok Leyland which is following trend line support and it is now on monthly resistance at 167 -168 now if price conform above 168 it's major breakout in monthly chart

Ashok Ley land Based on Monthly chart.
Already given confirmation in Bullish flag pattern for a Tgt1 : 194± of
When closing above (monthly close) it will get confirmation for cup and handle pattern.
Tgt 2 : 201± & Tgt 3 : 301±
As it is in monthly Time frame, tgt time will take time. Good for long term holding.
Note this is based on chart pattern and for learning purpose. Do your analysis from your side too.

#ASHOKLAYLAND FORMING CUP AND HANDLE PATTERN... IT IS AT ITS MULTIYEAR RESISTANCE...SOON BRRAKOUT CANDIDATE...KEEP IT IN UR WATCHLIST....not reco...post is only for an educational purpose do ur own diligence or check with ur financial advisor before taking any action.

ASHOKLEY viewsAs per my analysis, this script seems to have reacted well after building the support zone.
As shown in the chart drawing, it can hit potential target.
Worth watching for study purpose.
