ASIANPAINT trade ideas

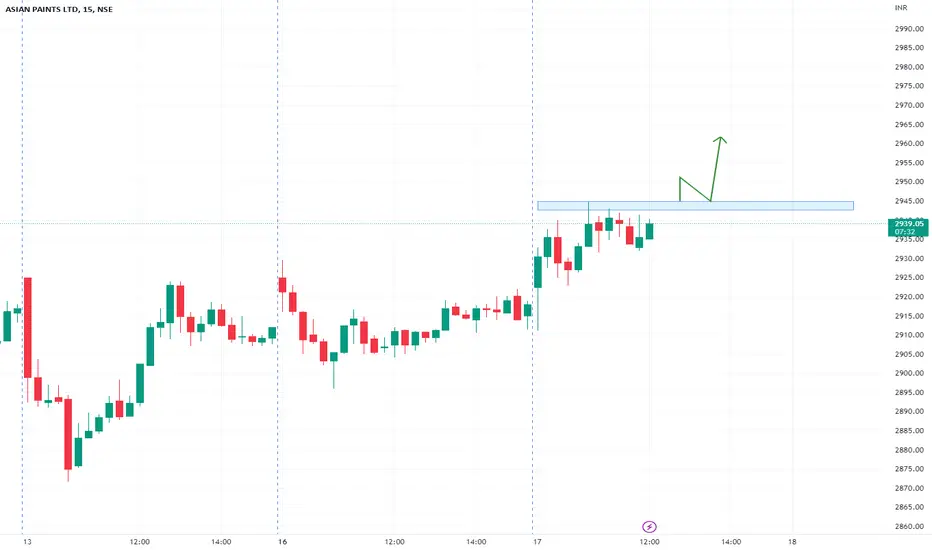
Trendline Breakdown in Asian Paints Limited...Chart is self explanatory.
Disclaimer: This is for demonstration and educational purpose only. This is not buying or selling recommendations. I am not SEBI registered. Please consult your financial advisor before taking any trade.

Asian paints in an way of head and shoulder breakout Asian paints was in a way of its bullish head and shoulder breakout also with full support of RSI ..
Buy it at 2856
Target 2918 2964 3027
Sl 2730


Bullish on ASIANPAINTwe have a support candle and a confirmation candle on the day chart. It's also forming a double bottom pattern, which is a que to enter. Buy above 2834.50


asian paint chart #trading #banknifty #trader #investing asian paints asian paints asian paints asian paints asian paints asian paints asian paints

Asian Paints stock price at good support zone?NSE:ASIANPAINT
Disclaimer:
This is just an analysis of Asian Paints stock from dividend yield point of view and technical price indicators point of view. Information provided here is only for educational purpose and in no way constitutes as an investment, trading, or financial advice. Please do your own research or consult your financial advisor before taking any investment or trading decision.
Dividend Point of View:
Company has regularly paid dividend in last 22 years.
Average dividend pay-out ratio in last 10 years is about 45%.
EPS of the company is steadily increasing.
The last dividend paid by company was for Rs.19.15 per share which translates to a dividend yield of 0.7% at today’s closing price of Rs.2726
Technical Point of View:
Historically, price has stayed mostly above EMA200 on weekly basis and EMA50 on monthly basis.
At present, price is less than 10% up from EMA200 (Rs.2541) and EMA50 (Rs.2483) on weekly and monthly basis respectively.
It is facing resistance just below 3600 levels on upside.
At today’s closing price of Rs.2726 and considering EMA200 and EMA50 as support and 3600 levels as resistance there is an upside possibility of about 32% with a downside risk of about 10% .
What can go wrong?
No one has control over the price of share. So, the price can go up as well as can go down. Based on EMA support zone, there is a downside risk possibility of about 10% though not limited to just 10%. Downside risk is calculated based on today’s closing price of Rs.2726 with EMA50 on monthly basis at Rs.2483 and EMA200 on weekly basis at Rs.2541. Thus, downside risk will vary based on entry price and exit price level.

ASIANPAINT- Positional Short tradeAsian paint shows a bearish trendline and takes support from its support level. and a high chance to break that level and give a good risk-reward ratio.
Entry Level:- Below @2770
Stop Loss:- Above @2840
Target:- 1:1 or 1:2

AP Demand ZoneASIANPAINTS Demand zone has marked in monthly timeframe weekly timeframe and day time frame. Lets see how the candles are moving .

asian paints bullish divergencehidden bullish div on both macd and rsi.
we are maintaining the sideways channel.
SL is 9% with 21% channel top target.
should go long

ASIANPAINT Buy for intraday tradingASIAN PAINT Buy for intraday trading if the stock breaks the given resistance level..........
Asian Paints NSE:ASIANPAINT
After a long time Asian Paints made hammer on strong demand zone . ASIANPAINTS showing strength .
Now time for go long in asian paints stocks

ASIANPAINTAsian paint is moving in a range. However, I have this analysis for a short time swing only.
It can give a 100-150 point move anywhere up or down once it breaks this range.
Trade safe. Manage risk. Be profitable.
Please follow us for more simple trading analysis and setups. Also let me know in the comment in case you have any queries.
Disclaimer :- This is just my view. Please analyze charts yourself and then decide to take any trades.

Asian paints Investment strategy Asian paints Investment strategy
Investment strategies in Asian Paints stocks
#asianpaints
Upper range 3500-3600
mid range - 2900-3000
lower range- 2600-2700

Asian Paints Head & Shoulder patternHead & shoulder pattern on Day chart of Asian Paints.
Also faced resistance of 200 ema (blue)
If stock breaks support of 3000 then candidate of short trades.
SL just above 3100. And downside target 2900, 2800.

#ASIANPAINT #BERGEPAINT #INDIGOPNTS #KANSAINER #SHALPAINTS #OIL#ASIANPAINT
NSE: ASIANPAINT
CMP: 3112
TP: 3332
SL: 3010
TF: <1m
RR > ~2 times
Return > 7%
BERGEPAINT ASIANPAINT KANSAINER SHALPAINTS NSE:INDIGOPNTS
Factors:
BULLISH WEDGE BREAKOUT
Trend Following
Rising Volume with rising Prices.
Flag pattern breakout.
Pennant Pattern Breakout with Bullish Candle.
Retest Successful.
Higher Highs & Higher Lows.
Broken above RESISTANCE levels
Trading at SUPPORT levels
Earnings are strong.
Bullish Wedge Breakout
Risk Return Ratio is healthy.
And
Rising from Double Bottom Pattern to Flag Pattern forming.
If you like my work KINDLY LIKE SHARE & FOLLOW this page for free Stock Recommendations.
With 💚 from Rachit Sethia

ASian PaintAsian Paints CMP 3055
SL 3000
Target 3500
Swing / Positional
Follow up chart.. Good bounce

ASIANPAINT..CASH..NSE..ANALYSISASIANPAINT GOING TOWARDS UPSIDE AFTER RETRACEMENT AS I SUGGESTED ON 4TH NOVEMBER, 2022... ONLY PATIENCE MATTERS ... RETRACE AFTER TOUCHING IMP SUPPORT LEVEL SUGGESTED IN ABOVE CHART... NOW MOVING TOWARDS GIVEN TARGETS
.
this study i published in last month nearby 4th November... now it's showing result

Asian Paints Long TermTechnical Analysis :
-- Strict Stop Loss = 3077
-- Target - 1 = 3387
-- Target - 2 = 3625
-- Target - 3 = 4232
-- Strong support at 2786.
-- Touching 55 EMA
Fundamental Analysis :
-- Current price is more than the intrinsic value
-- Maintaining a healthy dividend payout
-- CAGR: 10 years - 22%
-- Cash Flow is negative
-- ROCE : 27 %
As the PE ratio is a little high compared to the Median PE i.e 68.8. So keep on investing in a small amount

Short term tradewait for 2 weeks if target hits exit or exit after 2 weeks. if its comes down below 10% avg with more quantity and wait for recover. it will recover bcz its fundamentally good stock.

Asian Paints Bullish viewAsian paints :
Indicators
Price action
RR = 1:3
Looks like Asian paints has decided to use GREEN colors over RED ones.
