ASTRALi Observed these Levels based on Price Action and Demand & Supply which is my own Concept "PENDAM CONCEPTS"... Please don't take any trades based on this chart/post... Because this chart is for educational purpose only not for Buy or Sell Recommendation... Thank Q
ASTRAL trade ideas

Positional trade setup for Astral LtdThe chart for Astral Ltd. shows a potential reversal pattern after a prolonged downtrend, where the price has bounced off a key support level near ₹1850-1900. This level acted as strong support, and the stock is showing signs of recovery with recent bullish candles indicating renewed buying interest.
Observations:
Support Zone: The stock has tested and respected a strong support zone near ₹1850, which coincides with a recent bottom formation.
Recovery Signal: A bullish momentum is visible as the stock has crossed back above the ₹2000 level, with a notable upward move.
Positional Trade Setup:
Entry:
Aggressive Entry: Buy at the current levels of ₹2025 since the stock is in an upward trend from the support zone.
Conservative Entry: Wait for a slight pullback towards the ₹1950-2000 range for a better entry after a potential retest of the breakout level.
Target:
First Target (T1): ₹2250-2300, based on previous swing highs and resistance levels.
Second Target (T2): ₹2450-2500, if the stock continues its upward momentum.
Stop Loss:
Place a stop loss just below the recent support at ₹1850, which would invalidate the bullish setup if broken.
Timeframe:
This is a positional trade setup, so it could take a few weeks to a couple of months for the targets to be achieved, depending on market momentum.
Risk Management:
Position Size: Use moderate position sizing considering the stop loss is around ₹170 below the current price, offering a decent risk-to-reward ratio.
Trailing Stop Loss: Once the stock reaches ₹2200, you can move your stop loss to ₹2000 to lock in some gains.
Summary:
Entry: Buy at ₹2025 (current level) or on a pullback to ₹1950-2000.
Stop Loss: ₹1850.
Targets: ₹2250-2300 (T1) and ₹2450-2500 (T2).
This trade setup takes advantage of the bounce from key support, with the potential for a continued upside if the overall market remains bullish.

TREND REVERSAL IN ASTRALLong Term Trendline Broken
We can expect W pattern above 1980
RR Favorable at CMP

ASTRAL Flag bullish PatternAstral formed Flag pattern to go on bullish side. Expect stock to reach the target of 1952


ASTRAL NSE:ASTRAL
One Can Enter Now !
Or Wait for Retest of the Trendline (BO) !
Or wait For better R:R ratio !
Note :
1.One Can Go long with a Strict SL below the Trendline or Swing Low.
2. R:R ratio should be 1 :2 minimum
3. Plan as per your RISK appetite and Money Management.
Disclaimer : You are responsible for your Profits and loss, Shared for Educational purpose

ASTRALNSE:ASTRAL
Can buy at cmp
add till 1860
maintain
Sl- 1771
Target- 2000/ 2110/2286/2419
Pivot s2-1978
Trading at demand zone

NSE:ASTRAL Ltd's -Abki bar breakout ke liye Tayar 🌋???NSE:ASTRAL
Astral Poly Technik Ltd: Pioneering the Indian Plumbing and Adhesive Industry
Established in 1996, Astral Poly Technik Ltd set out with a vision to manufacture pro-India plumbing and drainage systems. Over the years, it has expanded into the adhesive business, marking its territory across multiple domains.
Historical Milestones
Astral has emerged as a frontrunner in the CPVC pipes and fittings sector in India. It pioneered the introduction of lead-free PVC pipes in 2004 and brought lead-free uPVC column pipes to the market in 2012. The company's strategic move into the adhesives space occurred in 2014, with the acquisitions of Seal IT Services Limited (UK) and Resinova Chemie Limited (RCL).
Diverse Product Range
Astral's portfolio extends beyond pipes to include water tanks, faucets, sanitary ware, and paints. It boasts approximately 37 variants in its pipe and tank segment and about 23 in adhesives.
Revenue Breakdown
A) Piping Division: Contributing 73% to the company’s revenues, Astral offers an array of products for various systems, including fire sprinklers and industrial applications. The acquisition of Rex Polyextrusion added specialties like corrugated pipes and telecom line protection systems to its arsenal.
B) Adhesives Division: Accounting for 27% of revenues, this division offers products ranging from epoxy adhesives and sealants to construction chemicals and tapes.
Inorganic Growth and International Presence
Astral has spread its wings internationally, with manufacturing in 3 countries and exports to over 25. It generates around 8% of its revenue from international sales.
Manufacturing Excellence
The company's manufacturing footprint includes eight piping and water tank facilities in India and five adhesives plants globally. To optimize logistics costs, Astral strategically positions its facilities to serve different regions within India and has recently expanded to Bhubaneswar, Odisha.
Future Expansion
Astral plans to augment the capacity of its Bhubaneswar plant and is establishing new facilities in Guwahati, Hyderabad, and Kanpur. These are set to become operational between FY24 and FY25, with a planned annual capex of ₹300-350 crore funded through internal accruals.
Extensive Distribution Network
The company's robust distribution network features over 2,750 distributors and more than 1,93,000 dealers. With a strong foothold in West and South India, the piping business is expected to grow in the North and East with new facilities.
Strategic Raw Material Sourcing
The company predominantly imports CPVC resin from Sekisui Chemical and relies on domestic giants like Reliance Industries for PVC resins.
New Ventures
In the pursuit of diversification, Astral ventured into faucets and sanitary ware in October 2021, eyeing a market potential of ₹15,000 Cr. This division is led by Mr. Atul Sanghvi, the former CEO of CERA, who has since resigned effective from 30.10.23. In the paints category, Astral acquired a majority stake in Gem Paints Pvt Ltd, with further investments to consolidate its position.
Brand Visibility
Astral leverages brand endorsement through Bollywood icons and sports associations. It has partnered with celebrities like Ranveer Singh and Allu Arjun to enhance its market visibility, allocating 2-3% of its net sales for promotional endeavors.
Subsidiaries and Growth
The company oversees 9 subsidiaries as of FY23, with a footprint extending beyond Indian borders.
As Astral Poly Technik Ltd continues to build on its strengths and explore new markets, it stands as a testament to the potential of Indian manufacturing and the importance of strategic growth.
Source: Screener.in
Disc: Invested for long time , adding in anticipation of breakout this time - Abki bar breakout ke liye tayar

Keep a close watch on AstralIts a strong buy zone as per Dominant & Trading (Short Term) Cycle. You may trade as per the levels given.

buy at zone - swing / intradayENTRY
- lines marked below is potential reversal zone ( PRZ)
- entry is strictly inside the zone
- look for buying confirmation in smaller time frame ( 15 minutes preferred )
EXIT
1. target
- mark fib retracement from C to latest swing low
- TGT 1 - 0.236 fib level ( intraday tgt)
- TGT 2 - 0.382 fib level
- TGT 3 - 0.5 fib level ( preferred target )
2. SL
- candle close below (PRZ)
- if u didn't get confirmation inside the zone , ignore this pick
- if candle close is below zone , this pattern becomes invalid . IGNORE THIS PICK
- RE-ENTRY can be done , if u again get buying confirmation inside the zone

ASTRAL INVESTMENT RESEARCHAstral For Long Term Stay Bullish Above 1929
2013/2097/2181/2286/2454
Support Near 1740/1893

ASTRAL INVETSMENT RESEARCHAstral Stay Bullish Above 1929
Target 2013/2097/2181/2286/2454
Support Near 1740/1893

ASTRAL BUY/SELL RESEARCHAstral Stay Bullish Above 1929
Target 2013/2097/2181/2286/2455
Support 1740/1893


Astral Looking Good. Astral IND looking good. Seems line wave ABC completed and starting new impulsive wave

ASTRAL Long OpportunityWe can go long from 2200 - 2250. Here is strong institutional buying zone.
Trade at your own risk.
I am not SEBI Registered.

Uptrend - 2 year breakoutBased on resistance and support levels, price breaking parallel range above 2 year resistance supporting rejection and retracement. further upward move is expected ( if price stays above 2164 ) to 14%-15% price apprx. 2500.
*only checking buying position, no short selling
!!Personal views only. please do your own research!!

Astral LtdTarget and SL mentioned in chart
OLD CHART
New Products and Expansion:
Paint business gearing up for new products and Astral brand launch in a phased manner
Bathware business showing quarter-on-quarter improvement with increasing sales
Capacity expansion plans for Hyderabad and Kanpur plants with timelines and estimated CAPEX provided
FUNDAMENTALS
Market Cap
₹ 55,968 Cr.
Current Price
₹ 2,084
52 Week High / Low
₹ 2,129 / 1,298
Stock P/E
99.2
Book Value
₹ 108
Dividend Yield
0.15 %
ROCE
23.6 %
ROE
17.9 %
Face Value
₹ 1.00
Price to book value
19.3
Intrinsic Value
₹ 476
PEG Ratio
4.71
Price to Sales
10.1
Debt
₹ 97.8 Cr.
Debt to equity
0.03
Int Coverage
31.8
Reserves
₹ 2,875 Cr.
Promoter holding
54.1 %
Pledged percentage
0.00 %
EPS last year
₹ 17.0
Net CF
₹ -112 Cr.
Price to Cash Flow
100
Free Cash Flow
₹ 247 Cr.
OPM last year
15.7 %
Return on assets
12.1 %
Industry PE
31.6
Sales growth
9.51 %

A stock which refuses to come down : AstralA fundamentally good company is running with good momentum. A healthy bull run with consolidation in between too. The upmove remains intact with support of volumes and DMI indicating there is still potential strength in the bullish momentum.
My view is to buy with an open target and SL trailing with the EMA

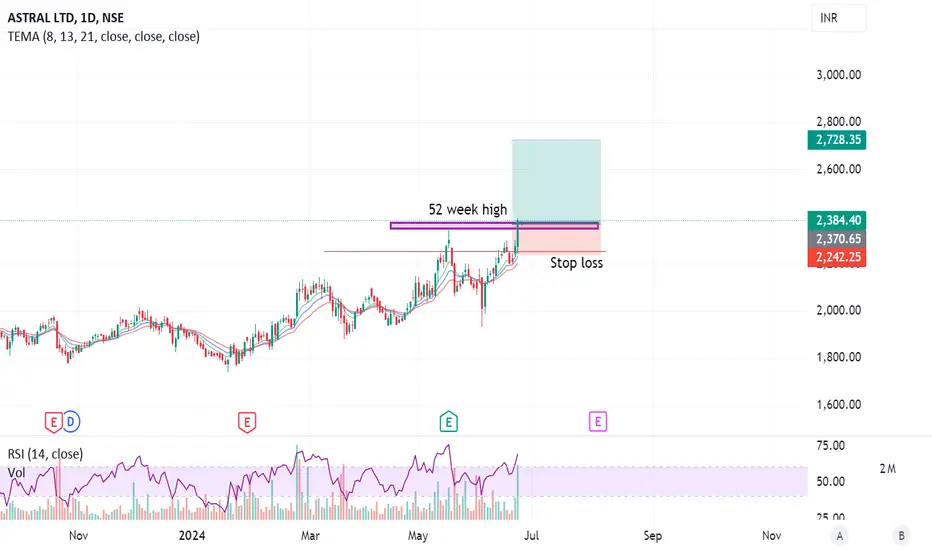
Astral positional strategyEntry:
Look for stocks, including Astral Ltd. (NSE), that recently crossed their 52-week high. This suggests potential upward momentum.
Stop Loss:
Place a stop-loss order 8% below the entry price. This limits your potential downside if the price moves against you.
Target:
Aim for a profit target of more than 15% above the entry price. This offers a good reward-to-risk ratio (assuming an 8% stop loss).
Additional Considerations:
Confirmation: While the stock crossing its 52-week high is a good starting point, consider additional confirmation for the uptrend. This could include technical indicators like moving averages or relative strength index (RSI) showing upward movement.
Volatility: Be aware of the stock's typical price volatility. An 8% stop loss might be too tight for a highly volatile stock, potentially leading to unnecessary exits.
Risk Management: This strategy focuses on a single price target. You can consider a trailing stop-loss to lock in profits as the price moves up or take partial profits at specific intervals.
Backtesting: Before deploying this strategy with real capital, consider backtesting it on historical data to assess its effectiveness and tweak parameters like stop loss and target percentages.
Disclaimer: This is a basic strategy and should not be considered financial advice. Always do your own research before making any investment decisions.
27-05-2024 - Stocks for intradayAll details are given on chart. If you like the analyses please do share it with your friends, like and follow me for more such interesting charts.
Disc - Am not a SEBI registered analyst. Please do your own analyses before taking position. Details provided on chart is only for educational purposes and not a trading recommendation

ASTRAL 1DayRetest is observed.
Good up move is expected.
.
.
.
.
.
.
I Am Not SEBI Registered Analyst. All Post and Levels Posting is only for educational and knowledge purpose. I Am not responsible for your any kind of loss or profit.
No Claim, All Rights Reserved.‼️

