BO with good volume and good newsThis pharma stock has given breakout with good volume
it has positive news as well i.e., gets CDSo nod for import of durvalumab for sale & distribution
If it sustains then we can dive
Happy Trading!
ASTRAZEN trade ideas

ASTRAZENECA PHARMA S/RSupport and Resistance Levels:
Support Levels: These are price points (green line/shade) where a downward trend may be halted due to a concentration of buying interest. Imagine them as a safety net where buyers step in, preventing further decline.
Resistance Levels: Conversely, resistance levels (red line/shade) are where upward trends might stall due to increased selling interest. They act like a ceiling where sellers come in to push prices down.
Breakouts:
Bullish Breakout: When the price moves above resistance, it often indicates strong buying interest and the potential for a continued uptrend. Traders may view this as a signal to buy or hold.
Bearish Breakout: When the price falls below support, it can signal strong selling interest and the potential for a continued downtrend. Traders might see this as a cue to sell or avoid buying.
20 EMA (Exponential Moving Average):
Above 20 EMA: If the stock price is above the 20 EMA, it suggests a potential uptrend or bullish momentum.
Below 20 EMA: If the stock price is below the 20 EMA, it indicates a potential downtrend or bearish momentum.
Trendline: A trendline is a straight line drawn on a chart to represent the general direction of a data point set.
Uptrend Line: Drawn by connecting the lows in an upward trend. Indicates that the price is moving higher over time. Acts as a support level, where prices tend to bounce upward.
Downtrend Line: Drawn by connecting the highs in a downward trend. Indicates that the price is moving lower over time. It acts as a resistance level, where prices tend to drop.
RSI: RSI readings greater than the 70 level are overbought territory, and RSI readings lower than the 30 level are considered oversold territory.
Combining RSI with Support and Resistance:
Support Level: This is a price level where a stock tends to find buying interest, preventing it from falling further. If RSI is showing an oversold condition (below 30) and the price is near or at a strong support level, it could be a good buy signal.
Resistance Level: This is a price level where a stock tends to find selling interest, preventing it from rising further. If RSI is showing an overbought condition (above 70) and the price is near or at a strong resistance level, it could be a signal to sell or short the asset.
Disclaimer:
I am not a SEBI registered. The information provided here is for learning purposes only and should not be interpreted as financial advice. Consider the broader market context and consult with a qualified financial advisor before making investment decisions.

Astrazeneca LongNSE:ASTRAZEN Weekly parabolic setup with buyers and macd momentum may continue bull run in fast and furious way.


Astrazenca Pharma- Nice BreakoutAstrazenca Pharma- Nice Breakout
Capital to be deployed- 20k
Investing Price -3943-3958
Breakout Price -3943
Stoploss -3620
Targets-4880-5142-5467
RT for max reach
#AstraZeneca #StocksToBuy #stocks #stockstowatch #StocksToTrade #SwingTrading

AstrazenAstrazen is ready for breakout either side
Mastery the price
This is only for education purpos

Astrazeneca Pharma Swing High Break*Astrazeneca Pharma*
Time Frame: daily
Observation:
* Swing High Break
* Breakout on 3284 level
Resistance/Target: 3974 4543 5124 5479
Support: 3284 3000

Head and shoulder pattern and daily volume breakoutHead and shoulder breakout
Daily volume breakout
T1: 3762
T2: 4123
SL: Right shoulder low

ASTRAZENCA BUY ABOVE @ 3000Breaking trendlines
And above 200 EMA level
pharma stock showing trend reversal

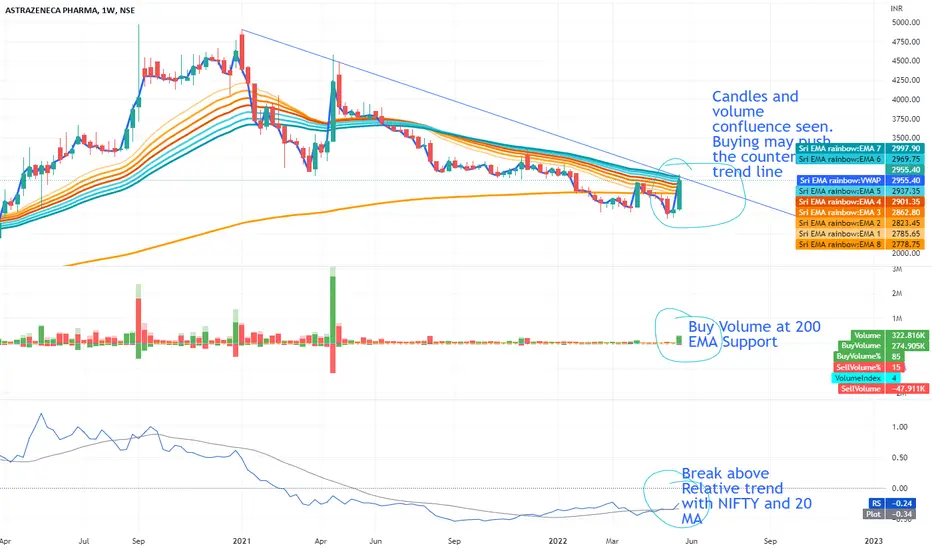
May go long based on Volume, Relative trend and Price actionAstra Zeneca, seems to reversing out of consolidation on Weekly - Testing trendline on the upside with good Marubozu candles supported by Good volume and break of RSI above NIFTY relative trend. Expect the trend to continue short - medium term, will watch next week candle before taking position.
T1: 3311
T2: 4337
T3: 4892
These are not very far off from the Fibonacci reversal levels
SL before 200 EMA.
head and shoulder in astrazen pharmaplease give a stop loss while trading
this pattern make in this stock then tread and make healthy profit

ASTRAZENECA PHARAMA TAKEN GOOD SUPPORTStock is taken good support at multiple times in the same area.
Looking good too long here for 10% Upside for Swing.

ASTRAZENA PHARMA DAILY CHART Descending triangle breakout , best buy around 3100-3125 , tgt 3280/3350

astrazenBusiness area of the company
The Company is engaged in the business of manufacture, distribution and marketing of life-changing medicines in crucial areas of healthcare including oncology, cardiovascular, diabetes, renal, metabolic and respiratory.
Core Therapy Areas
Cardiovascular
Oncology
Respiratory

ASTRAZENECA PHARMALooking strong buying zone
Buy from bottom with small SL
Target mentioned in chart
Do your own analysis before investing

Possible breakout after consolidationPossible breakout after consolidation. Price movement and target as mentioned in chart.
Education purpose.


ASTRAZENCA PHARMATHOSE HOLD THIS STOCK PLEASE MAINTAIN A STOP LOSS OF 3700 AND GO LONG. DOWN TREND FOR THIS STOCK IS FINISHED AND NOW CONSOLIDATION PERIOD ALSO ENDED & IS READY TO BOUNCE BACK , TARGETS MARKED IN THE GREEN . CONTINUE HOLDING WITHOUT WORRY . REST CONSULT UR FINANCIAL ADVISOR BEFORE INVESTING IN THIS , THESE ARE MY THOUGHT AND I MAY BE WRONG .


Buying signals present for Astrazeneca PharmaRead news here, here and here. .
Bullish trend intact. Expecting price to go higher
