AUBANK Long Trade Idea🔔 BUY Signal Alert! 🔔
🔗 Ticker: AUBANK
🌐 Market: India Equities
🔄 Side: Long
⏱️ Type: Swing Trade
🎯 Entry: 620.00
🛑 Stop Loss: 597.40
🥇 First Profit Target: 647.60
🏆 Final Profit Target: 681.20
The CHAMLEO EDGE model uses a proprietary algorithmic program at the pre-market auction to identify potential stocks for each day. The algorithm then calculates where there is strong buying or selling pressure on the stock and sends buy or sell signals.
The signal provides a suggested stop loss price based on calculations that the movement may no longer be valid. It also provides a first suggested level for realizing potential profits, indicating that there is a resistance level just beyond this price that may cause the stock to stop and possibly reverse. If this level is surpassed, there is potential to achieve possible profits at a price better than the first profit level, allowing the possibility of extending potential gains.
AUBANK trade ideas


Does $NSE:AUBANK will Take Support ?Dear Readers,
I hope this message finds you well. I am reaching out to provide you with a crucial update regarding our particularly concerning NSE:AUBANK
After thorough analysis and consideration of market trends and stock performance indicators, we have identified an opportune entry point for initiating a Buy position in Mention Stock
The entry level for initiating a Buy position is set at 560-565 , Stop Loss 540, Target 590 and 610 . We believe this price point presents a favorable opportunity to capitalize on potential upward movements in the stock's value.
It's important to note that involves inherent risks, and as such, we recommend exercising caution and conducting your own due diligence before making any investment decisions.
This message is for informational purposes only and should not be considered financial advice. It is crucial to conduct thorough research or consult with a financial advisor before making any investment decisions. We do not guarantee the accuracy or completeness of the information provided.
Best Regards

AUBANKAUBANK Chart Analysis 19/03/2024...........
Long : 564
Sl : 560 closing basis
Target : 591 / 610
==================================
Sell : below 560
Sl : 565 Closing basis
Target : 516
Enjoy !
Note : To avoid big loss, use tight stop-loss. If someone wants to take deep stop loss, then along with stop loss of 500 level, buy at level 564 or 516 level.........

AUBANK Analysis::Double top is identified in this stock...
we have strong demand lies at 440 levels.
price is now at support zone...price is aleady moved tomuch downside...
it is risky to enter short...
wait for the retracement to enter short side again.
we have a chance of Head and Shoulders in this stock. which is a reversal pattern in this stock price.
key support and resistance levels is given in the chart, take a look at these levels and trade accordingly.

AUBANK: gapdown + regression trend breakdown Stock witnessed a breakdown from regression trend and at same time breakdown came on back of earnings, most important to note is that the gap down came below key support zones and thus expect them to head lower.
the stock shown a bounce from lower zones ie retracement seemingly done
once it start to trade below 580, aggressive pyramid in short will take place
the view will be negated if stock start to trade above 630 mark

AU Bank (chart for study)Multiple Gap Up and Gap Down then filled
now 590 Gap up fill pending
support 550-580
AU Small Finance
Price ₹ 600 M.Cap ₹ 40,093 Cr PE 25.2
Item YOY Dec 2023 Sep 2023 Dec 2022
Sales ⇡ 29% 2,736 2,531 2,118
EBIDT ⇡ 22% 1,459 1,390 1,194
Net profit ⇣ 4% 375 402 393
EPS ⇣ 5% ₹ 5.61 ₹ 6.01 ₹ 5.89
[Positional] AUBank Buy IdeaNote -
One of the best forms of Price Action is to not try to predict at all. Instead of that, ACT on the price. So, this chart tells at "where" to act in "what direction. Unless it triggers, like, let's say the candle doesn't break the level which says "Buy if it breaks", You should not buy at all.
=======
I use shorthands for my trades.
"Positional" - means You can carry these positions and I do not see sharp volatility ahead. (I tally upcoming events and many small kinds of stuff to my own tiny capacity.)
"Intraday" -means You must close this position at any cost by the end of the day.
"Theta" , "Bounce" , "3BB" or "Entropy" - My own systems.
=======
I won't personally follow any rules. If I "think" (It is never gut feel. It is always some reason.) the trade is wrong, I may take reverse trade. I may carry forward an intraday position. What is meant here - You shouldn't follow me because I may miss updating. You should follow the system I share.
=======
Like -
Always follow a stop loss.
In the case of Intraday trades, it is mostly the "Day's High".
In the case of Positional trades, it is mostly the previous swings.
I do not use Stop Loss most of the time. But I manage my risk with options as I do most of the trades using derivatives

Au bank view for 20th Feb Tuesday #aubankAu bank view for 20th Feb Tuesday #aubank
Charts for Educational purposes only.
Please follow strict risk reward and stop loss if you follow my level
Thanks,
V Trade Point

what Next in $NSE:AUBANKDear Followers,
I hope this message finds you well. I wanted to provide you with a brief update on the stock NSE:AUBANK I have been monitoring.
It appears that the stock is approaching a potential Support level Near 615-610 This is an important technical point where the price has historically had difficulty breaking through. It suggests that we may see a temporary halt in the current upward momentum and Possibly it will test 650-670 In Upmove.
Resistance Levels to Watch out.
Resistance levels are the opposite, representing prices at which a stock has historically struggled to move above. These levels can signal a selling interest. Understanding resistance points is crucial for anticipating potential obstacles in the upward movement of a stock.
R1= 660
R2= 685
R3= 710
Support Levels To Watchout.
Support levels represent prices at which a stock has historically had difficulty falling below. These levels often indicate a strong buying interest. It's important to monitor these levels, as a breach might suggest a potential downward trend.
S1= 610
S2= 580
S3= 555
As always, please remember that investing involves risks, and it's important to carefully consider your options. If you have any questions or would like to discuss this further, please don't hesitate to reach out.
Best regards,

AUBANK has broken 3.5 year old trendlineNSE:AUBANK has broken nearly 3.5 year old trendline today (in blue) and if this breakdown sustains then we should see 550 soon. Be cautious if you're long.

sell au bank for desend targetdear all price give a sell singnal if price trade below 618 and ghold till 11.15 am if price trade below price may comes to 582-570-543 levels today or tommorow if price close belw price may give more down .. so we see in this stock for 582-570-543 levels .. thanks

au bank ltd price at supportdear all au bank at very good levels and trade in very good setup so 10% down as good for us buy au bank for good investment ... aacha paisa banega aur aaj ka low k niche ka daily basis closing laga k rakhna price aapko good return degi

$aubankhola folks
nice discount near the 200 ema zone
likely will hold that or a slim chance of a deviation below for loquidity and run it back
been looking more at the nifty lately since size is bigger and a 5% move is good enough without leverage
recon nifty gets through the 217 level by end of week

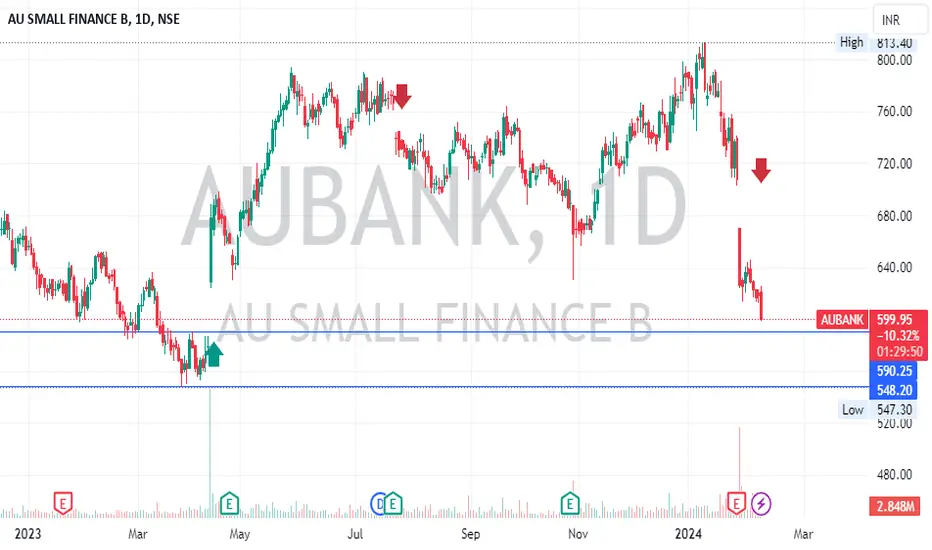
Automated liquidation activity in AU Small Finance Bank!Automated liquidation activity near all-time high levels in the AU Small Finance Bank.

AU SMALL FINANCE BANK GIVES BREAKOUT Small finance Bank gives of weekly as well as 4 hour break out and we can see a very good level of 962 from Current lavel and Star Plus will be below 750 4 hour candle close


AUBANKThese are swing ideas which you can add your watchlist and analysis for yourself !
Keep on your radar!
This I am not sebi ragister❗

AUBANK, keep a watch in coming weeks.A rounding bottom pattern in formation. Keep in watchlist for targets of 830 and sl below range.

AU Small Finance Bank Daily timeframe analysis for long term
NSE:AUBANK has given 6 month resistance breakout and retested at 760 range.
We can see long term move above 760 with SL of 740 and can average till 750.
Major targets levels are highlighted in blue lines.

AU BANK (READY TO GO!)AU BANK is in channel pattern for past six months and correct more than 20% since its last high.
The stock is fundamentally strong stock and now starts looking bullish from technical perspective as well.
Long Term Targets are 808 and 890.
Confluence To Support Our Idea:
*Approaching near 50 day EMA
*Taking strong rejection from demand area.
*Fib Retracemen @0.618.
We can look for buying opportunity on marked zone.possibilty to see new higher highs in coming sessions.

AU BANK MAKE OR BREAK LEVELAU bank come to the 580-590 level for fill the gap after this we can see some upside in this stock

AUBANK Breakout confirm strong bullishAUBANK has given the breakout. It has been in the range then gave a breakout now again it has given the 2nd breakout people who missed the 1st rally might enter now. It will be a nice trade of 1:4 :: R: R.
Reason:
Bullish Flag and POLE breakout.
Support at the VWAP.
RSI is entering in Bullish zone.
Successful breakout after 5 months
High Volume is traded today.
Price > EMAs
Verdict :
Highly Bullish
Plan of action:
Buy: 754
Stoploss: 726
Target: 870
