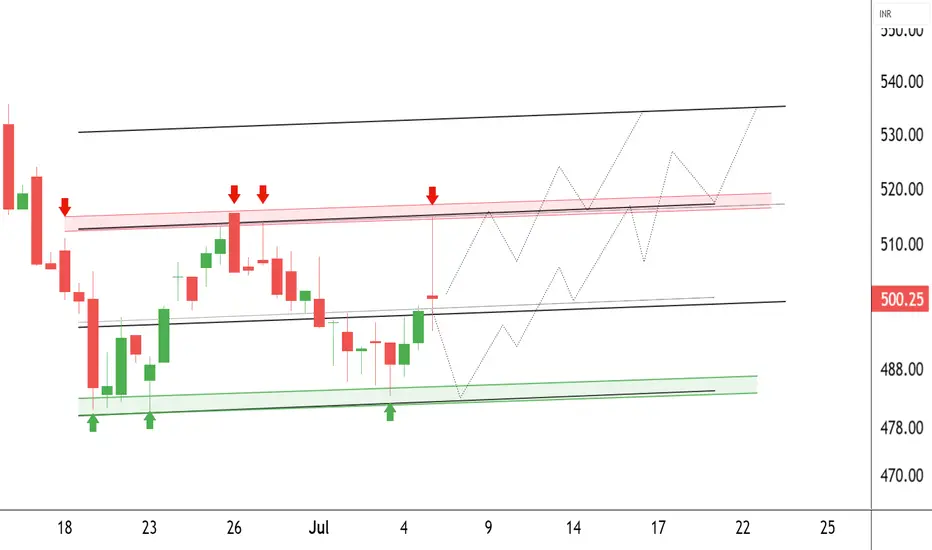
Avadh Sugar & Energy Limited at Best Support !! Breakout This is the 1 hour chart of Avadh Sugar & Energy Limited .
AVADHSUGAR is trading within a well-defined parallel channel and is currently positioned near its L.O.P boundary support zone around ₹495–₹500.
The lower boundary of the channel is 480-490 level and The upper boundary of the channel is pos
Next report date
—
Report period
—
EPS estimate
—
Revenue estimate
—
35.40 INR
879.35 M INR
26.36 B INR
8.48 M
About AVADH SUG & ENERGY LTD
Sector
Industry
Website
Headquarters
Kolkata
Founded
2015
ISIN
INE349W01017
FIGI
BBG00H9P9BK1
Avadh Sugar & Energy Ltd. engages in the production, manufacturing, and sale of sugar and sugar products. It operates through the following segments: Sugar, Distillery, Co-Generation, and Others. The Sugar segment manufactures and sells sugar, molasses, and bagasse. The Distillery segment offers industrial spirits, fusel oil, and bio-compost products. The Co-Generation segment deals with the generation and transmission of power. The Others segment covers the trading of petroleum products business. The company was founded on March 19, 2015 and is headquartered in Kolkota, India.
Related stocks
Avadh Sugar Energy heading towards 8000+ levels (Long Term)As the prices of commodities are soaring high due to increasing demand and inflation, Sugar & Ethanol prices will rise as well leading to improved operating profit margins.
This sector is capital intensive, only the existing players will be immensely benefitted due to ethanol blending.
Price to BV &

Great swing opportunity in Avadh Sugar A nice cup with handle pattern is in play.
It is best to buy at the bottom of the handle to minimize the drawdown and maximize the reward to risk ratio.
The broader view shows, the price is moving in an ascending channel pattern.
Currently price is ranging near 600 which is also at 200 days MA & bot

💥Avadh Sugar and Energy💥-Nice Breakout💥Avadh Sugar and Energy💥-Nice Breakout
Capital to be deployed- 20k
Investing Price-790-805
Breakout Price-783
Stoploss-630
Targets-1059-1602
RT for max reach
#avadhsugar #stockstowatch #StocksToBuy #StocksInFocus #stocks #StockMarket

AVADHSUGARNSE:AVADHSUGAR
One Can Enter Now ! Or Wait for Retest of the Trendline (BO) Or wait For better R:R ratio
Note :
1.One Can Go long with a Strict SL below the Trendline or Swing Low of Daily Candle.
2. Close, should be good and Clean.
3. R:R ratio should be 1 :2 minimum
4. Plan as per your RISK

AVADHSUGAR 1D 1WTRADING COMMUNITY
JOIN US ONLY IF YOU WANT PEACE AND PROFIT IN YOUR TRADING LIFE.
I am not a call provider, not SEBI approved person. All the charts and PnL here are for educational purposes. Consult a professional financial advisor before you invest.

#AVADHSUGAR #RAJSREESUG #UGARSUGAR #MAWANASUG #KCPSUGIND #NIFTY
#AVADHSUGAR
NSE:AVADHSUGAR
CMP: 544
TP: 684
SL: 494
TF: <6m
RR > 2.8 times
Return 25%
Factors:
BULLISH WEDGE BREAKOUT
Trend Following
Rising Volume with rising Prices.
Flag pattern breakout.
Pennant Pattern Breakout with Bullish Candle.
Retest Successful.
Higher Highs & Higher Lows.
Broken above

AVADH SUGAR BULLISHAvadh Sugar has just started it'S upward journey. Price is above 50 EMA in weekly and daily time frame. There is trendline breakout with high volumes with upper bollinger band challenged. All EMAS positive crossover.
Weekly MACD uptick after down.
Daily RSI is in momentum.

1200.00 on cards - sugar sector Excellent chart setup, 650.00 stop loss , buy in dips, 1200.00++ on cards

AVADHSUGAR looks goodCMP 623
tgt 2x
Disclaimer:
All information shared is just for educational purposes.
By no means shall we be accountable for any debits/losses amounting out of it.
We are not SEBI registered Analysts, so please consult your Investment Advisor and take rational decisions.

See all ideas
Summarizing what the indicators are suggesting.
Oscillators
Neutral
SellBuy
Strong sellStrong buy
Strong sellSellNeutralBuyStrong buy
Oscillators
Neutral
SellBuy
Strong sellStrong buy
Strong sellSellNeutralBuyStrong buy
Summary
Neutral
SellBuy
Strong sellStrong buy
Strong sellSellNeutralBuyStrong buy
Summary
Neutral
SellBuy
Strong sellStrong buy
Strong sellSellNeutralBuyStrong buy
Summary
Neutral
SellBuy
Strong sellStrong buy
Strong sellSellNeutralBuyStrong buy
Moving Averages
Neutral
SellBuy
Strong sellStrong buy
Strong sellSellNeutralBuyStrong buy
Moving Averages
Neutral
SellBuy
Strong sellStrong buy
Strong sellSellNeutralBuyStrong buy
Displays a symbol's price movements over previous years to identify recurring trends.
Frequently Asked Questions
The current price of AVADHSUGAR is 429.80 INR — it has decreased by −1.72% in the past 24 hours. Watch AVADH SUGAR & ENERGY LIMITED stock price performance more closely on the chart.
Depending on the exchange, the stock ticker may vary. For instance, on BSE exchange AVADH SUGAR & ENERGY LIMITED stocks are traded under the ticker AVADHSUGAR.
AVADHSUGAR stock has fallen by −3.01% compared to the previous week, the month change is a −12.71% fall, over the last year AVADH SUGAR & ENERGY LIMITED has showed a −27.15% decrease.
AVADHSUGAR reached its all-time high on Apr 22, 2022 with the price of 884.95 INR, and its all-time low was 88.50 INR and was reached on Mar 25, 2020. View more price dynamics on AVADHSUGAR chart.
See other stocks reaching their highest and lowest prices.
See other stocks reaching their highest and lowest prices.
AVADHSUGAR stock is 3.53% volatile and has beta coefficient of 2.40. Track AVADH SUGAR & ENERGY LIMITED stock price on the chart and check out the list of the most volatile stocks — is AVADH SUGAR & ENERGY LIMITED there?
Today AVADH SUGAR & ENERGY LIMITED has the market capitalization of 8.97 B, it has increased by 0.50% over the last week.
Yes, you can track AVADH SUGAR & ENERGY LIMITED financials in yearly and quarterly reports right on TradingView.
AVADH SUGAR & ENERGY LIMITED is going to release the next earnings report on Nov 5, 2025. Keep track of upcoming events with our Earnings Calendar.
AVADHSUGAR net income for the last quarter is −84.14 M INR, while the quarter before that showed 716.77 M INR of net income which accounts for −111.74% change. Track more AVADH SUGAR & ENERGY LIMITED financial stats to get the full picture.
Yes, AVADHSUGAR dividends are paid annually. The last dividend per share was 10.00 INR. As of today, Dividend Yield (TTM)% is 2.23%. Tracking AVADH SUGAR & ENERGY LIMITED dividends might help you take more informed decisions.
AVADH SUGAR & ENERGY LIMITED dividend yield was 2.24% in 2024, and payout ratio reached 22.76%. The year before the numbers were 1.88% and 15.63% correspondingly. See high-dividend stocks and find more opportunities for your portfolio.
As of Aug 6, 2025, the company has 1.96 K employees. See our rating of the largest employees — is AVADH SUGAR & ENERGY LIMITED on this list?
EBITDA measures a company's operating performance, its growth signifies an improvement in the efficiency of a company. AVADH SUGAR & ENERGY LIMITED EBITDA is 2.47 B INR, and current EBITDA margin is 10.74%. See more stats in AVADH SUGAR & ENERGY LIMITED financial statements.
Like other stocks, AVADHSUGAR shares are traded on stock exchanges, e.g. Nasdaq, Nyse, Euronext, and the easiest way to buy them is through an online stock broker. To do this, you need to open an account and follow a broker's procedures, then start trading. You can trade AVADH SUGAR & ENERGY LIMITED stock right from TradingView charts — choose your broker and connect to your account.
Investing in stocks requires a comprehensive research: you should carefully study all the available data, e.g. company's financials, related news, and its technical analysis. So AVADH SUGAR & ENERGY LIMITED technincal analysis shows the strong sell today, and its 1 week rating is strong sell. Since market conditions are prone to changes, it's worth looking a bit further into the future — according to the 1 month rating AVADH SUGAR & ENERGY LIMITED stock shows the sell signal. See more of AVADH SUGAR & ENERGY LIMITED technicals for a more comprehensive analysis.
If you're still not sure, try looking for inspiration in our curated watchlists.
If you're still not sure, try looking for inspiration in our curated watchlists.