AXISBANK- Breakout Bullish SetupAxis bank has given a breakout from its Resistance zone and volume profile showing high volume traded at a near higher price, it is giving high probability to continue uptrend after a breakout above @965 level.
Entry Level:- Above @965
StopLoss:- Below @958 After breaout of level @965
Target:- 1:1 or 1:2
AXISBANK trade ideas

long position in AXIS BANKAxis bank is on its altime high you it it breaks it alltime high zome we can make a long position in it with a target od 6-9 percent holding period 1-2 weeks

banknifty chart #trading #banknifty #trader #investingaxis bank chargt for long side view have a look on axis bank

DAILY TIME FRAME - AXISBANKThe Structure looks good to us, waiting for this instrument to correct and then give us these opportunities as shown on this instrument (Price Chart).
Note: Its my view only and its for educational purpose only. Only who has got knowledge about this strategy, will understand what to be done on this setup. its purely based on my technical analysis only (strategies). we don't focus on the short term moves, we look for only for Bullish or Bearish Impulsive moves on the setups after a good price action is formed as per the strategy. we never get into corrective moves. because it will test our patience and also it will be a bullish or a bearish trap. and try trade the big moves.
we do not get into bullish or bearish traps. We anticipate and get into only big bullish or bearish moves (Impulsive Moves). Just ride the Bullish or Bearish Impulsive Move. Learn & Know the Complete Market Cycle.
Buy Low and Sell High Concept. Buy at Cheaper Price and Sell at Expensive Price.
Keep it simple, keep it Unique.
please keep your comments useful & respectful.
Thanks for your support....
Tradelikemee Academy


AXIS bank BreakOutTrading at 944,
918 was Break out level
RSI above 70 may get a dip and will be fantastic buy for 1000-1050 levels (positionally)
made flag pattern, looks making double flag.
We have seen in past has given fantastic returns again is getting ready for it.
disclaimer- personal views please take advise from your advisor before investing.

Axis bank 15 minAxis bank formed triple top it is already at higher high if candle breaked trendline we will sell the
axis bank or else it breaked the resistance we will be on buy side

Axis Bank Sustaining at an all-time high. Gave the breakout retested from the levels. Got a rejection from 950 levels.

Axis bank multi year breakout and retestAxis bank Chart is recently breakout from multiyear resistance. and retestead that level also
Entry: near cmp
Stop loss: if close below 820
Target : as per your risk/reward ratio
⚠️ Important: Always maintain your Risk & Reward Ratio.
⚠️ Purely technical based pick.
✅Like and follow to never miss a new idea!✅
Disclaimer: I am not SEBI Registered Advisor. My posts are purely for training and educational purposes. please consider it as a lerning
Eat🍜 Sleep😴 Job & swing Trade📈 Repeat🔁
Happy learning with Earning. Cheers!🥂


AXISBANK CHART ANYLAYS BRAEKOUT POINT AXIS BANK 908 to 909 is most impotent level is AXIS BANK
breakout this point 908 to go up this target 918 and up side clear move
NSE:AXISBANK

Axis BankStock already good move , New entry guys should enter all high if sustain with good volume candle can enter
If fall below trend line we can expect correction at this stock , This chart for Knowledge sharing

Axis Bank support and resistance Lable on my point of view Axis Bank support and resistance Lable on my point of view

Axis Bank Intraday Trade 22/11/22
Axis Bank Intraday Trade only with Price action !!
R:R = 1:2 Running

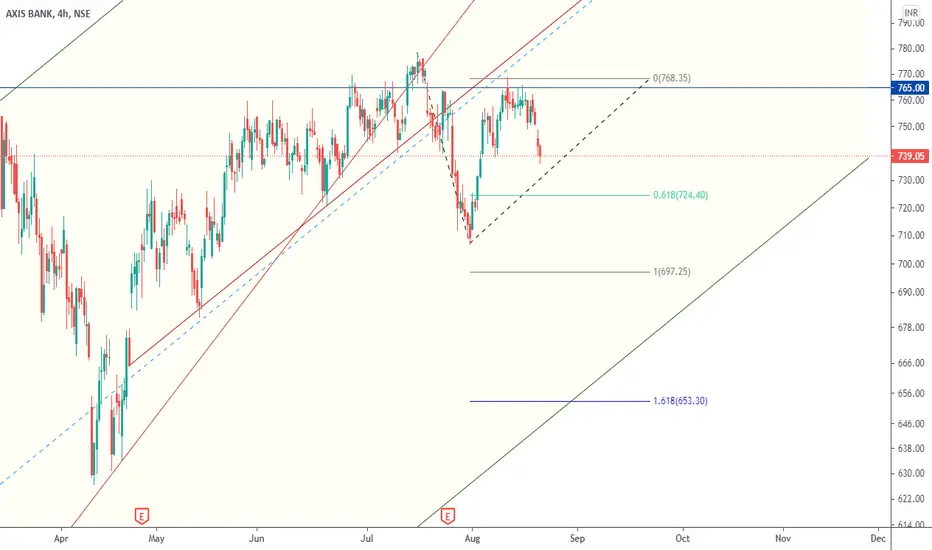
Axis BankTrendline resistance at highs, one of the resistance is providing support at a point if price pullsback one can consider going short


Axis Bank- Raring to go up n up and over .......Hi Traders,
Presenting my views on Axis Bank.
The sudden up rally on 20th Oct propelled stock from 839 levels to 870-900 levels to create all time highs, but past few week have seen stock come back to levels of 840-860 to fill the gap as one can see in chart.
With breakout of Inside Bar and stock trading above 855-860 levels in coming days can gather the lost momentum to be back at the top and continue its upward journey.
Growth in life and in stock market is inevitable if investment done in right manner.

Axis Bank for IntradayAxis bank is looking good for sell below 870 and buy above 880. its just a view not any recommendation for trade.


Axis Bank Hey traders this is Axis bank hourly chart this is in range of 860 to 880
above 880 will be good for buy side
Below 855 will be short

Giving 2nd opportunity to initiate Long Refer the chart for detailed analysis.........................

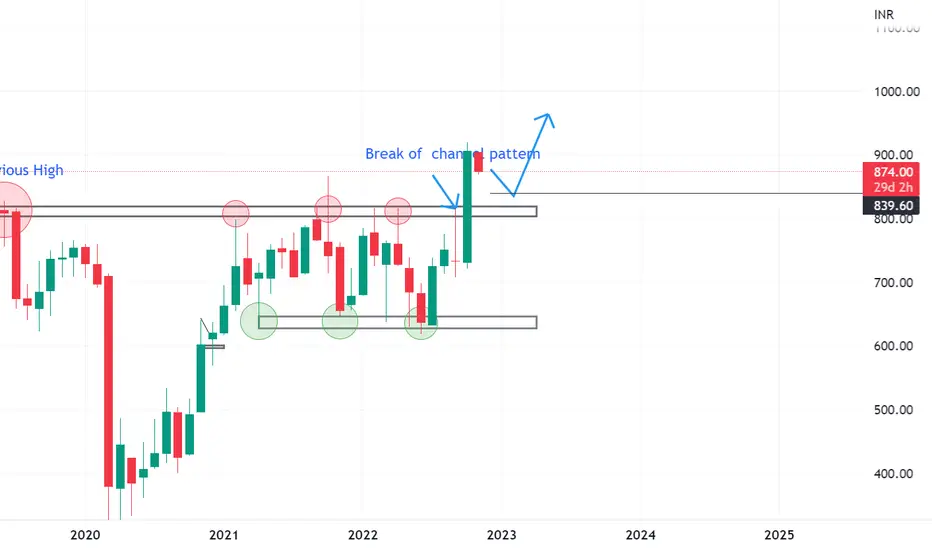
#AXIS BANK (Monthly Pattern Breakout)The stock was in channel pattern for quite long time which it breaks in the recent sessions. The price is currently retracing ,and provide us a good longing opportunity on the pull backs. The price can Retrace upto @840 and even can go for deeper pullbacks @810.