AXISBANK trade ideas

AXISBANKHi, Axis bank long term Target 2300
Monthly wave 1 or A leading diagonal completed and
correction wave 2 or B completed.
now going on wave 3 or C.
my point of view axis bank long term investment good.

Axis BankBuy above 814 for Target of 900+
Time is 3 month
There is a breakout level on 814(closing basis)


Axisbank nearing Breakeout near 793- short term viewAxisbank nearing Breakeout near 793- short term view in 15 mins chart. Keep strict SL @780 for a target of 824

AXISBANk buy for intraday tradingAXISBANk buy for intraday trading if stock and BANKNIFTY also strong then we will enter in trade.....

AXIS BANK - NSEOne of the top 3 private banks of a super growing economy.
300 million people still unbanked, demand will only grow.
Also they are front runners in adopting blockchain technology.
Huge land bank and no debt on books, its a great company to invest.

AXISBANK ANALYSISCMP: 721.25
Entry on breaking of the Symmetric Triangle Pattern
Upside Targets: 745-749, 756-760
Support: 708
Downside Targets: 608

Falling Wedge Pattern - Axis BankFalling wedge pattern has been broken by a strong bullish candle in Axis bank in 30 mins TF.
Wait for Re-test and buy between 720 - 722 and Target price is as mentioned on the chart.
This is my view and for educational purpose only.


Axis Bank On 1hr timeframe
Axis Bank forming Rising Wedge Pattern on very important resistance 749
One can go short after trendline breakout

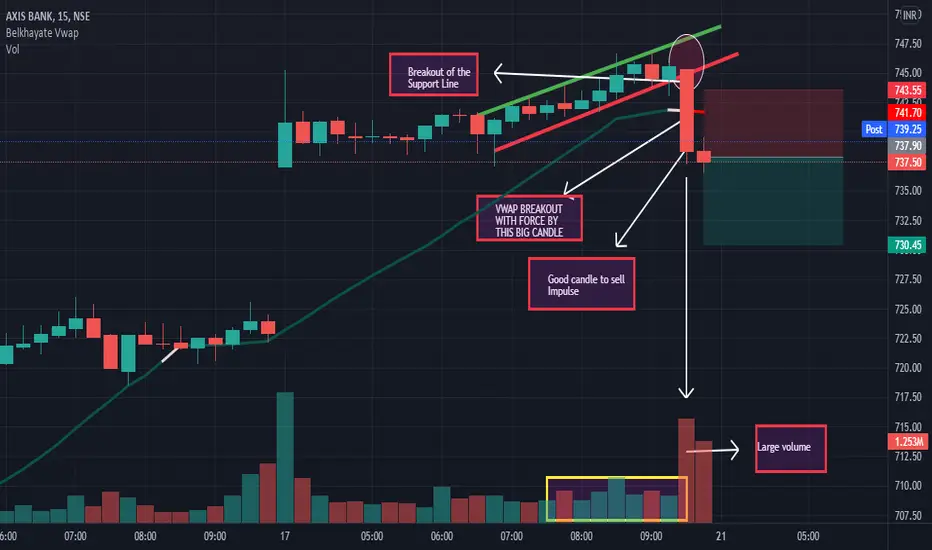
Sell on AXISBANK DOWNTRENDGood morning... On AXISBANK...we have a good probability to sell with the breakout of the support with force and with a large volume...

AXISBANK ANALYSISCMP: 690.85
The stock has been consolidating for a while on a shorter time frame and now I am expecting a good move from the CMP
Support: 689
Downside Target: 677.5
Resistance: 705
Upside Target: 715-718

BULLISH in Axis bank at 736 , stop loss 730 Target 745I am bullish in axis bank with 736 at opening stop loss 730 with target of 745. The target may be at intraday or positional.

AXISBANK SHORTAxisbank short....God told me. After a long day at work, i heard god's voice and he said to short axis bank with all your life's savings and put your house a collateral.

#axisbank #swingtrade #consolidateAsix bank in consolidation zone i mark the area if axis bank break its consolidate zone then we will take trade accordingly.
Thank you


AXISBANK ANALYSISThis is for someone who loves to trade the market structure
CMP: 787.40
Uptrend on shorter time frame followed by a pullback and now we have a good consolidation between 780-790
If 790 is broken and it sustains then
Upside Target: 797-798, 805-806
If 780 is broken and it remains down then
Downside Target: 766-768

AXIS BANK ANALYSIS WITH HM SYSTEMAxis Bank Analysis NSE:AXISBANK on Higher time frame or intermidiate or lower time frame .

Long axisbank at cmp and dips for 772-800+Details on chart, axis gave a breakout after a long consolidation.

Axis Bank short for 550 LevelsSeems that in corrective mode,
ABC Correction
Upside Max limited to 780-790 level, downside around 550-520 levels
will go on selling with proper money management rules.

