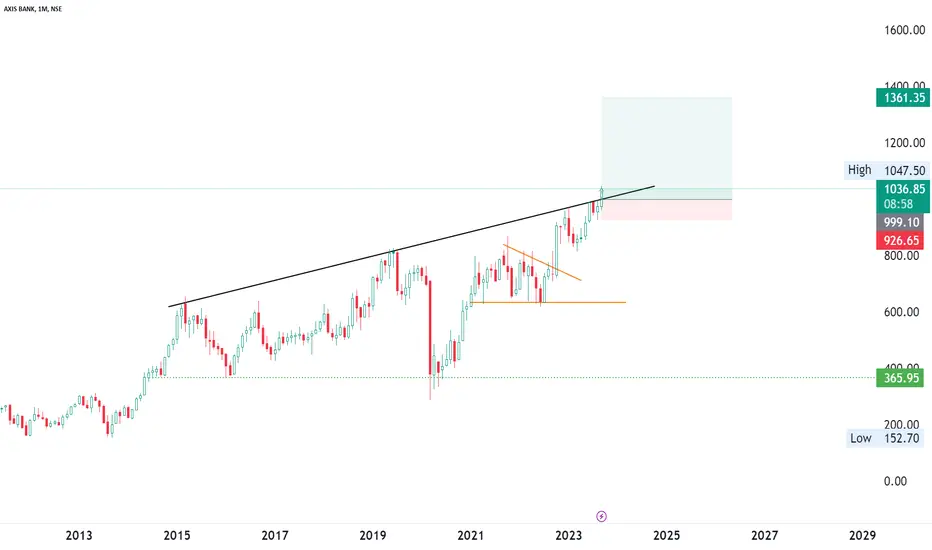
AXIS BANK--DZ & Trendline Resistance??AXISBANK is still in its bearish trend....
if we clearly observe we have a strong demand zone lies at 884.
On the topside, we have a resistance in the form of trendline.
keep safe here going long in this stock price.
we have strong liquidity above the trendline, after grabbing that liquidity price may again turns to be bearish.
we know already price taken the trendline liquidity below the support levels at 920-960 levels.
If price takes the liquidity again at 920 levels with a strong consolidation will go for long side when it enters in the demand Zone.
Wait and watch levels are trendline Resistance and demand Zone.
fake breakout chances are more above the upside trendline.
if price breaks the trendline strongly then on a pullback we have to look for a buy until avoid buying in this stock price.
AXISBANK trade ideas

AXISBANKNSE:AXISBANK
One Can Enter Now !
Or Wait for Retest of the Trendline (BO) !
Or wait For better R:R ratio !
Note :
1.One Can Go long with a Strict SL below the Trendline or Swing Low.
2. R:R ratio should be 1 :2 minimum
3. Plan as per your RISK appetite and Money Management.
Disclaimer : You are responsible for your Profits and loss, Shared for Educational purpose
Axis BankPrice & Time analysis. It is in at very crucial junction. Bigger trend is down. But we have see some up strength.

AXISBANK KEY LEVELS FOR 18/02/2025//description
// All credit goes to Tony for the concept of this indicator. His Trading View link: www.tradingview.com
// Note: The calculation method in this indicator differs from Tony's, but the concept is derived from his work.
I want to make it clear that I am not a seller, and this method was not taught to me by anyone. The original creator only gave me one clue:
👉 "If you get one level, you get all levels."
Everything else—the way I nail it the method and applied it—is my own work. I respect the original idea, but my approach is independent.
Explanation:
This trading system helps you avoid blind trades by providing confirmation for better entries and exits.
Entry/Exit Points:
- Entry/Exit Lines: Use the BLACK line for long trades and the RED line for short trades, based on confirmation from your trading plan.
- Stop Loss: For long trades, set the stop loss at the RED line below. For short trades, set it at the BLACK line above.
- Take Profit: For long trades, target the next RED line above. For short trades, target the next BLACK line below.
Timeframe:
Use a 5 mins timeframe for trading.
Risk Disclaimer:
This setup is for educational purposes. I'm not responsible for your gains or losses. Check the chart for more details.

Axis Bank Demand ZoneAxis Bank Demand Zone refers to a specific price level or range where Axis Bank's stock is expected to find strong buying interest, potentially leading to a reversal or bounce in its price. This concept is commonly used in technical analysis by traders and investors to identify key support levels.
Key Points:
1. Demand Zone: A price area where buyers are likely to step in, causing the price to rise. It is often identified by previous areas of consolidation, support levels, or areas where the price has reversed upward in the past.
2. How to Identify:
- Look for historical price levels where Axis Bank's stock has consistently found support.
- Use tools like horizontal support lines, moving averages, or Fibonacci retracement levels.
- Analyze volume patterns to confirm increased buying activity at these levels.
3. Why It Matters:
- Helps traders identify potential entry points for buying the stock.
- Provides a risk management tool by setting stop-loss orders just below the demand zone.
- Indicates areas where the stock is likely to reverse or consolidate.
4. Current Demand Zone for Axis Bank:
- To identify the current demand zone, you would need to analyze the stock's recent price action on a chart. For example, if Axis Bank's stock has recently bounced from a price level of ₹1,000 multiple times, that level could be considered a demand zone.

AXISBANK KEY LEVEL FOR 17/02/2025//description
// All credit goes to Tony for the concept of this indicator. His Trading View link: www.tradingview.com
// Note: The calculation method in this indicator differs from Tony's, but the concept is derived from his work.
I want to make it clear that I am not a seller, and this method was not taught to me by anyone. The original creator only gave me one clue:
👉 "If you get one level, you get all levels."
Everything else—the way I nail it the method and applied it—is my own work. I respect the original idea, but my approach is independent.
Explanation:
This trading system helps you avoid blind trades by providing confirmation for better entries and exits.
Entry/Exit Points:
- Entry/Exit Lines: Use the BLACK line for long trades and the RED line for short trades, based on confirmation from your trading plan.
- Stop Loss: For long trades, set the stop loss at the RED line below. For short trades, set it at the BLACK line above.
- Take Profit: For long trades, target the next RED line above. For short trades, target the next BLACK line below.
Timeframe:
Use a 5 mins timeframe for trading.
Risk Disclaimer:
This setup is for educational purposes. I'm not responsible for your gains or losses. Check the chart for more details.

AXIS BANK PROJECTION FOR THIS MONTH 10 FEB2025 TIME 22.45 Axis Bank is one of India’s leading private sector banks, offering a comprehensive range of financial products and services to individuals, businesses, and corporations. Established in 1993 as UTI Bank and later rebranded as Axis Bank in 2007, the bank has grown significantly over the years, establishing a strong presence in both domestic and international markets. Headquartered in Mumbai, India, Axis Bank operates through a vast network of branches, ATMs, and digital platforms, providing seamless banking experiences to its customers. The bank's business operations span across retail banking, corporate banking, and treasury services. In retail banking, Axis Bank offers savings and current accounts, fixed and recurring deposits, credit and debit cards, personal loans, home loans, vehicle loans, and wealth management solutions. Its corporate banking segment caters to large and mid-sized enterprises, offering working capital loans, trade finance, treasury management, and cash management services. Additionally, Axis Bank has a strong focus on digital banking and fintech collaborations, ensuring innovative solutions for customers through platforms like mobile banking, internet banking, and UPI-based services. The bank also actively participates in investment banking, foreign exchange services, and financial advisory, further diversifying its portfolio. With a commitment to sustainability and corporate social responsibility, Axis Bank continues to expand its footprint in India's banking sector, driving financial inclusion and economic growth.

Axis Bank Share Price UpdateAs of the close of trading on Tuesday, February 4, 2025, Axis Bank's share price stood at ₹1,015.45, marking a 2.62% increase from the previous day. This performance surpassed the broader market, with the BSE SENSEX Index rising by 1.81% to 78,583.81. Despite this gain, Axis Bank's shares remain 24.19% below their 52-week high of ₹1,339.55, achieved on July 12, 2024

AXISBANK KEY LEVELS FOR 03/02/2025**Explanation:**
This trading system helps you avoid blind trades by providing confirmation for better entries and exits.
**Entry/Exit Points:**
- **Entry/Exit Lines:** Use the BLACK line for long trades and the RED line for short trades, based on confirmation from your trading plan.
- **Stop Loss:** For long trades, set the stop loss at the RED line below. For short trades, set it at the BLACK line above.
- **Take Profit:** For long trades, target the next RED line above. For short trades, target the next BLACK line below.
**Timeframe:**
Use a 5 mins timeframe for trading.
**Risk Disclaimer:**
This setup is for educational purposes. I'm not responsible for your gains or losses. Check the chart for more details.

AXISBANK - Whats nExt?So after some anticipation from my indian friends for HDFC Bank LTD, here its for AXISBANK ltd. Here breaking blackline with vol, would fill the 1033 the upside tasuki gaps, but high FVG below the line i marked!

Axis bank Sell @937Key Concepts of Smart Money Concepts (SMC)
1. Market Structure
– Higher Highs and Higher Lows (HH, HL): In an uptrend, the price creates higher highs and higher lows.
– Lower Highs and Lower Lows (LH, LL): In a downtrend, the price creates lower highs and lower lows.
– Understanding these patterns helps traders identify the overall trend direction.
2. Liquidity Zones
– Liquidity Pools: Areas where stop-loss orders are clustered, often around significant support and resistance levels. Institutions target these areas to fill their orders.
– Order Blocks: Areas of consolidation before significant price moves. These are often the zones where institutional buying or selling has occurred.
3.Order Flow
– Understanding Supply and Demand: Traders analyze how supply and demand dynamics affect price movements. An imbalance between buyers and sellers can lead to significant price changes.
– Market Orders vs. Limit Orders: Recognizing the difference can help assess where liquidity may be present in the market.
4. Smart Money vs. Retail Traders
– Smart Money: Refers to institutional traders who have access to more information, resources, and capital. Their actions often dictate market movements.
– Retail Traders: Individual traders who may not have the same level of insight. SMC aims to align trades with the actions of smart money.
5.Market Sentiment
– Understanding market sentiment helps traders gauge the emotional state of the market. Sentiment can be bullish, bearish, or neutral and affects price movements.
Practical Application of SMC
1. Identifying Entry and Exit Points:
– Traders look for price action around key liquidity zones and order blocks to identify potential entry points. For example, entering a trade when price retraces to an order block after a breakout.
2.Using Price Action:
– Analyzing candlestick patterns, trends, and reversals helps traders make informed decisions based on real-time market behavior.
3. Risk Management:
– SMC emphasizes the importance of managing risk by setting stop-loss orders near key levels and adjusting position sizes based on market conditions.
4. Combining with Other Tools:
– Many traders use SMC alongside other technical analysis tools (like Fibonacci retracements, moving averages, etc.) to enhance their trading strategies.

AXIS BANK A SURE SHOT AT A SHOTDecline in profits plus a formation of Bearish pennant and Bearish Flag in short term. A quick 30-60 points to make on the chart.
Recent Financial Performance:
Profit Miss and Asset Quality Concerns: In the third quarter ending December 31, 2024, Axis Bank reported a 4% year-over-year increase in standalone net profit to ₹63.04 billion, which fell short of analysts' expectations of ₹65.16 billion. This shortfall was primarily due to a significant rise in provisions for bad loans, which more than doubled to ₹21.56 billion. Additionally, the gross non-performing asset (NPA) ratio increased slightly to 1.46%, indicating some deterioration in asset quality.
Loan Growth Slowdown: The bank's loan growth decelerated to 9% year-over-year, down from 11% in the previous quarter. This slowdown reflects a cautious approach amid rising asset quality concerns.
Analyst Perspectives:
UBS Assessment: UBS has expressed concerns about Axis Bank's rising non-performing loans and has adjusted its target price for the bank's shares to ₹1,210.
LKP Research Outlook: Contrastingly, LKP Research maintains a bullish stance, recommending a 'buy' rating with a target price of ₹1,228.
Market Performance:
Recent Share Movements: As of January 24, 2025, Axis Bank's stock closed at ₹959.85 per share, marking a 0.85% decline for the day.
Industry Context:
Regulatory Impact: The Reserve Bank of India's measures to curb retail lending have led to a slowdown in credit growth across the banking sector, resulting in increased provisions for bad loans and a rise in non-performing assets. This regulatory environment has adversely affected the profitability of several banks, including Axis Bank.

AXISBANK KEY LEVELS FOR 27/01/2025**Explanation:**
This trading system helps you avoid blind trades by providing confirmation for better entries and exits.
**Entry/Exit Points:**
- **Entry/Exit Lines:** Use the BLACK line for long trades and the RED line for short trades, based on confirmation from your trading plan.
- **Stop Loss:** For long trades, set the stop loss at the RED line below. For short trades, set it at the BLACK line above.
- **Take Profit:** For long trades, target the next RED line above. For short trades, target the next BLACK line below.
**Timeframe:**
Use a 5 timeframe for trading.
**Risk Disclaimer:**
This setup is for educational purposes. I'm not responsible for your gains or losses. Check the chart for more details.

LONGApproaching back to the trend line, where it may reverse. Q3 results are good. Possible price TAGS are given. If it breaks the trend line, SL is needed.

AXISBANK NSE:AXISBANK
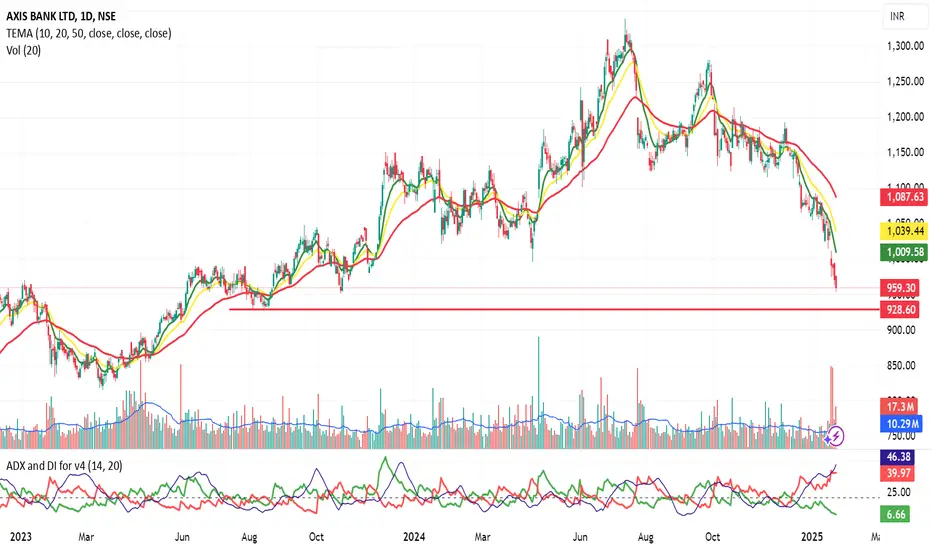
Support and Resistance Levels:
Support: The 928.60 level seems to be a strong support level as the price has bounced off it several times.
Resistance: The 1059.94 level could act as a resistance level in the near term.
Future Movement:
Based on the current trend and technical indicators, it is likely that AXIS BANK LTD will continue to move higher in the near term. However, it is important to keep an eye on the 1059.94 resistance level. If the price breaks above this level, it could signal further upside potential.
Disclaimer: This analysis is based on the provided chart and technical indicators. It is not financial advice and should not be used as the sole basis for investment decisions. Please consult with a financial advisor before making any investment decisions.
AXISBANK KEY LEVELS FOR 23/01/2025**Explanation:**
This trading system helps you avoid blind trades by providing confirmation for better entries and exits.
**Entry/Exit Points:**
- **Entry/Exit Lines:** Use the BLACK line for long trades and the RED line for short trades, based on confirmation from your trading plan.
- **Stop Loss:** For long trades, set the stop loss at the RED line below. For short trades, set it at the BLACK line above.
- **Take Profit:** For long trades, target the next RED line above. For short trades, target the next BLACK line below.
**Timeframe:**
Use a 5 timeframe for trading.
**Risk Disclaimer:**
This setup is for educational purposes. I'm not responsible for your gains or losses. Check the chart for more details.

Axis Bank ShortAxis Bank Short & then Long Trade
Short Entry
CMP
Target 981
Long Entry 980
Target 1135
Price will enter long term correction after that.
SL 1193

Axis Bank - Support Zone.- The chart is self-explanatory as always.
- We have reached a support zone after dropping 5% today owing to lukewarm results.
- Axis Bank Q3 results: Net profit rises 4% YoY to Rs 6,304 crore, misses estimates
- The 1000 may act as a crucial point.
- Keep an eye on it.
Disclaimer: This analysis is purely for educational purposes and does not constitute trading advice. I am not a SEBI-registered advisor, and trading involves significant risk. Please consult with a financial advisor before making any investment decisions.

AXIS BANK LTD S/R Support and Resistance Levels:
Support Levels: These are price points (green line/shade) where a downward trend may be halted due to a concentration of buying interest. Imagine them as a safety net where buyers step in, preventing further decline.
Resistance Levels: Conversely, resistance levels (red line/shade) are where upward trends might stall due to increased selling interest. They act like a ceiling where sellers come in to push prices down.
Breakouts:
Bullish Breakout: When the price moves above resistance, it often indicates strong buying interest and the potential for a continued uptrend. Traders may view this as a signal to buy or hold.
Bearish Breakout: When the price falls below support, it can signal strong selling interest and the potential for a continued downtrend. Traders might see this as a cue to sell or avoid buying.
MA Ribbon (EMA 20, EMA 50, EMA 100, EMA 200) :
Above EMA: If the stock price is above the EMA, it suggests a potential uptrend or bullish momentum.
Below EMA: If the stock price is below the EMA, it indicates a potential downtrend or bearish momentum.
Trendline: A trendline is a straight line drawn on a chart to represent the general direction of a data point set.
Uptrend Line: Drawn by connecting the lows in an upward trend. Indicates that the price is moving higher over time. Acts as a support level, where prices tend to bounce upward.
Downtrend Line: Drawn by connecting the highs in a downward trend. Indicates that the price is moving lower over time. It acts as a resistance level, where prices tend to drop.
Disclaimer:
I am not a SEBI registered. The information provided here is for learning purposes only and should not be interpreted as financial advice. Consider the broader market context and consult with a qualified financial advisor before making investment decisions.

AXISBANK LevelsSupport Level: This is a price level where a stock tends to find buying interest, causing it to reverse direction or consolidate. It's the "floor" of the stock's price.
Resistance Level: This is a price level where selling interest tends to emerge, preventing the price from rising further. It's the "ceiling" of the stock's price.
Methods to Identify Support and Resistance:
Historical Price Action: Look at the past price chart of Axis Bank and identify areas where the stock has previously reversed or consolidated. These can act as potential support or resistance levels.
Round Numbers: Traders often watch psychological price levels like ₹1000, ₹1200, ₹1500, etc., as they tend to act as support or resistance.
Trendlines: Draw trendlines that connect lows (for support) or highs (for resistance). These can act as dynamic support or resistance levels.
Moving Averages: Simple Moving Averages (SMA) or Exponential Moving Averages (EMA) like the 50-day and 200-day moving averages can serve as support or resistance levels, especially when the stock is trending.
Fibonacci Retracement Levels: Fibonacci levels can help identify possible areas of support and resistance based on key percentages like 23.6%, 38.2%, 50%, 61.8%, and 78.6%.
Volume Analysis: High-volume areas near certain price points can signify strong support or resistance.
If the stock is currently trading at ₹980 and starts trending towards ₹950 without breaking below, then ₹950 becomes a strong support level. Similarly, if the stock faces selling pressure at ₹1050, it could be a resistance level.

AXIS BANK AT TL SUPPORT
Axis Bank is forming a **symmetrical triangle pattern**, and it’s better to wait for a **candle confirmation** at the weekly time frame closing before planning an entry. For a **short-term plan**, can expect a target up to the **resistance level**.

Axis Bank LongAxis Bank
MTF Analysis
Axis BankYearly Demand Breakout 867
Axis Bank 6 Month Demand Breakout 867
Axis BankQtrly Demand BUFL 970
Axis BankMonthly Demand 1045
Axis BankWeekly Demand 1071
Axis BankDaily Demand DMIP & Cap 1037
ENTRY -1 Long 1071
SL 996
RISK 75
Target as per Entry 1234
RR 2
Positional Target 1757
Target Points 163
Recent High 1,340

Axis Bank | Long | Intraday | BTSTAxis Bank has taken a good support from the Monthly S2 Pivot zone and is showing the first sign of buyers stepping in.
Though I'm not Bullish on a larger time frame basis, a relatively quick bullish option buy trade can be taken for target to 1090 level.
