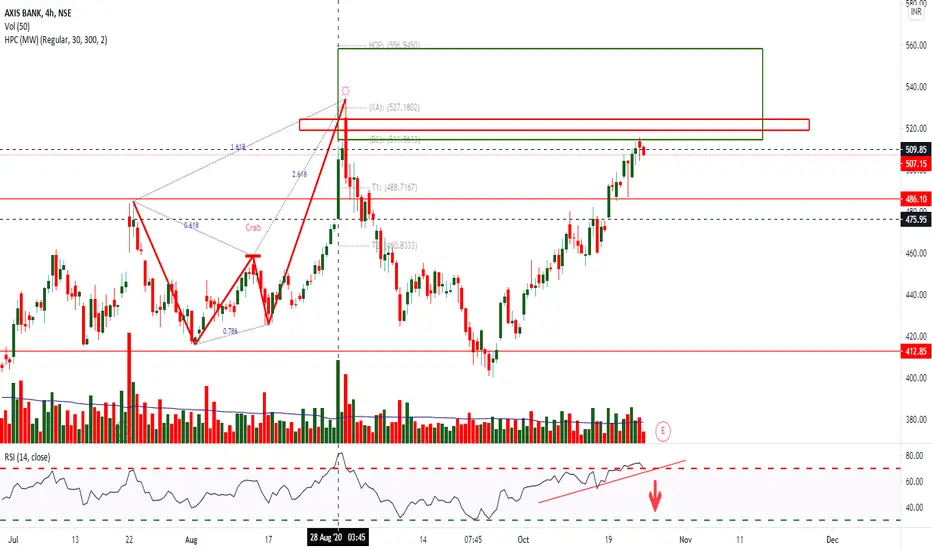
Axis bank shows Bearish divergence on 4h chart.Wait for the close and look for profit booking 450 levels
AXISBANK trade ideas


AXIS BANK 4HRCONFLUENCE of daily butterfly zone & 4hr crab strong zone
Withiin 3-5 price bars need the confirmation from a BEARISH CANDLE with RSI Below 70
POTENTIAL SELL

AXIS BANK DAILY BEARISH Butterfly ,Earlier this same pattern given good reaction on Type1 entry & Hit Targets
now price again came into PRZ , it Becomes a TYPE2 Entry which is REVERSAL
within 3-5 bars after getting confirmation from a Bearish CANDLE with RSI BELOW 70
POTENTIAL SELL


AXIS BANK DAILY Bearish Butterfly TYPE 2 Entry ,Earlier this Pattern given good reaction on Type1 entry & Hit TARGETS now price again came into PRZ Zone of Pattern it becomes a TYPE2 Entry which is REVERSAL
Ultra high volume up bars - trap of Smart Money , Higher volume- Professionals are selling into the public buying
SET UP BECOMES VALID ONLY when RSI is below 70 and IF Price breaks ULTRA HIGH VOLUME Candle LOW with LOW VOLUMES & with NO DEMAND l.e place for short
POTENTIAL SELL

AXISBANK (NSE) - Elliott wave analysis - sell set upAXISBANK - It seems one impulse cycle ended in 30 min time frame from last bottom and need to correct down. Sell with high as stop loss as 515.60 level for downside 490 or lower target as medium odd trade set up.
Give thumbs up if you really like the trade idea.


AXIS BANK Next Journey Any of my investment or trades I share on my view are provided for educational purposes only and do not constitute specific financial, trading or investment advice. ... You must be aware of the risks and be willing to accept them in order to trade or invest in markets. Don't trade with money you can't afford to lose.


AXISBANK - Elliott wave analysis - sell set upAXISBANK - It is within corrective cycle as ABC zigzag up with 5th wave as diagonal structure in C wave. Sell when price dropped below 459.60 with last high as stop loss in 10 min time frame for target zone near 438-44.
Give thumbs up if you really like the trade idea.

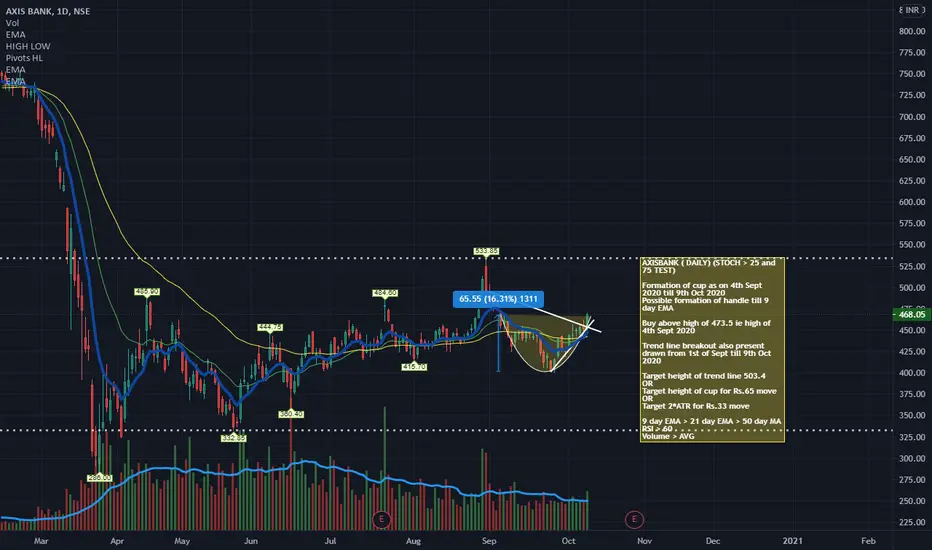
AXISBANK ( DAILY) - Cup and Handle BreakoutAXISBANK ( DAILY) (STOCH > 25 and 75 )
Formation of cup as on 4th Sept 2020 till 9th Oct 2020
Possible formation of handle till 9 day EMA
Buy above high of 473.5 ie high of 4th Sept 2020
Trend line breakout also present drawn from 1st of Sept till 9th Oct 2020
Target height of trend line 503.4
OR
Target height of cup for Rs.65 move
OR
Target 2*ATR for Rs.33 move
9 day EMA > 21 day EMA > 50 day MA
RSI > 60
Volume > AVG

AXIS BANK 1HRBearish shark ..Ultra high volume up bars - trap of Smart Money , Higher volume- Professionals are selling into the public buying
Horizontal BLACK DOTTED lines r High & Low of ULTRA HIGH Volume CANDLE .Vertical dotted line is ULTRA HIGH VOLUME i.e SMART MONEY SET UP BECOMES VALID ONLY when RSI is below 70 and IF Price breaks ULTRA HIGH VOLUME Candle LOW with LOW VOLUMES & with NO DEMAND l.e place for short
POTENTIAL SELL


AXIS BANK (NSE) - Elliott wave analysis Welcome guys,
CycleWave is the top author sharing trade ideas based on EW analysis since last five months on the global stocks, currency pairs, cryptos, future indices and commodities. You can follow us to get more trade ideas/analysis.
Axis Bank (NSE) - It dropped in double zigzag from last major top as shown in chart. Then it start moving up within zigzag too. there is two possible probability - (1) is either it will go higher by subdividing the C wave as extension OR (2) is it will go down as the part of correction down further. So there is a common small downward price action. So wait for more price action to get further direction of the trend. Probably price will go down up to 435 from top 445.40 as the common price correction in both option.
Give thumbs up if you really like the trade idea.
