AXISBANK - GO LONG FOR A RR OF 1:7 TOMORROW MORNINGAXISBANK - GO LONG @ 401 WITH A SL OF 399 AND A TARGET OF 415. TARGET SHOULD BE ACHIEVED BY 27 APRIL 2020, 1ST HALF.
AXISBANK trade ideas

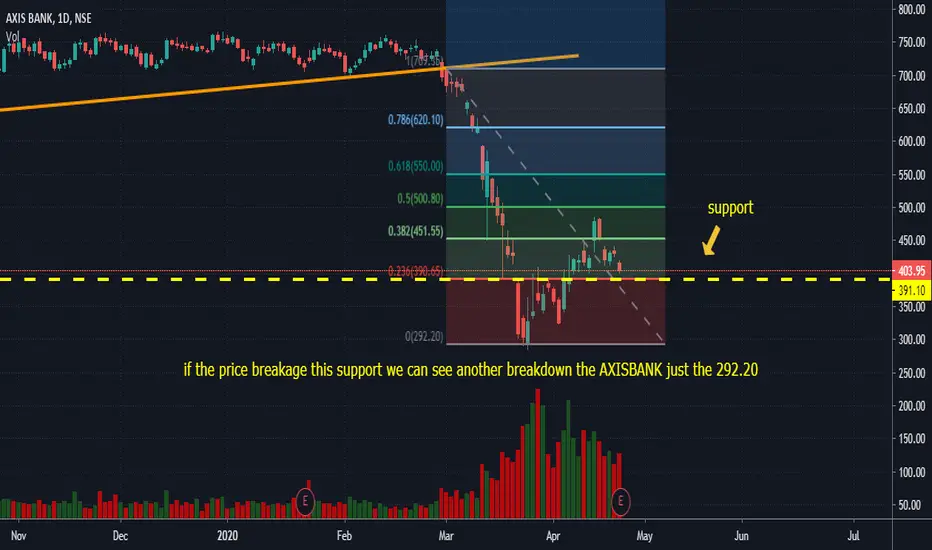
pay attention : potential breakdown the AXISBANK stockf the price breakage this support we can see another breakdown the AXISBANK just the 292.20
found head and shoulder in axis bank .looking for shor.hello
found head and shoulder pattern in axisbank.

AXISBANK - OPIND0004
Opportunity
-Channel breakout as banking industry is in complete negative sentiment
-Along with industry the new of “Frankline Templeton” has make the sentiment more negative.
Caution
-Could respect the channel very less chances.

30M Sell - Axis bank Axis bank resistance at 438 Sell at 430 Target - 415 - 400 levels mostly Intraday. close at the end of the day.


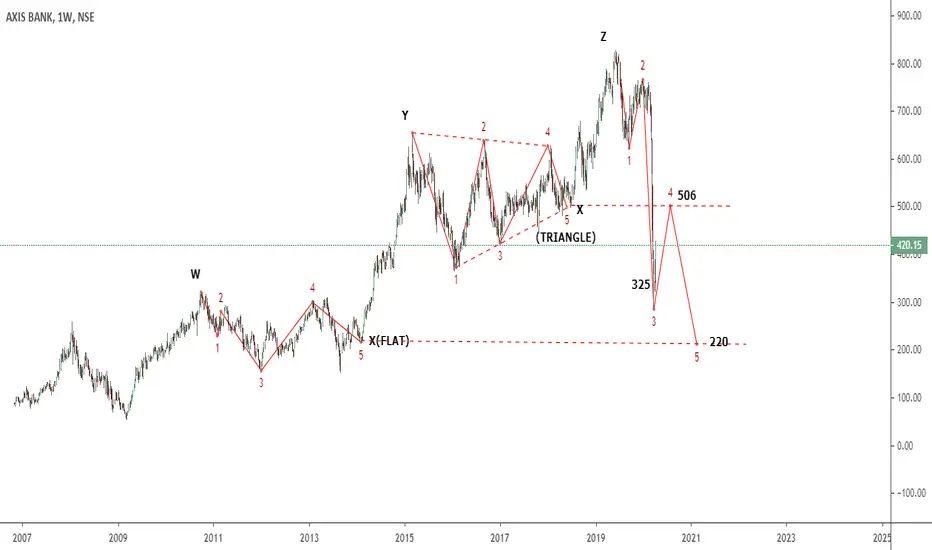
AXIS BANK LONG TERM WAVE COUNTAxis bank is a deciplined stock which obeies and respect all chart patterns and elliot wave pattern.this type of stock is good for trading.
5 waves wX,Yx,Z or (12345) COMPLETED and now correction started.wave A COMPLETED AT 325.
THIS upward move is flat in nature and wont go more than 506 because the fall is steep.
after completing wave B near 506 again it will fall for wave C which is a motive wave mercy less wave will bring down axis to 220.
prepare and invest accordingly
Axis Bank Tomorrow 3 April will go down03 April 2020 Trade - Short Axis Bank near 354-362 add 1 more if gets near 368-372 Sl above 380 tgts minimum ist tgt- 339 2nd tgt 323 and final tgt if comes near 302. Trial your sl if once comes to ist tgt. I am not responsible for ur profits or losses. Do proper money management before entering into trade.

AXISBANK WEEKLYBullish Crab@1.618XA
now price is at 1.618XA..Crab may also go to 1.902XA Before giving REVERSAL
if we get Confirmation with a Bullish Candle with RSI above 30 then
POTENTIAL BUY


Axis Bank Do or Die zoneAxis Bank Stock Is trading at a very important level right now.
Price is at the Trendline on weekly time frame.
Stock is already down 67% from its all time high and 27% today.
If this level Breaks, we could see 220 next as classic 0.786 Retracement Support.

AXIS BANK BULLISH BAT FORMATION AT MARKET BUY OPPORTUNITYAXIS BANK STOCK IS TRADING NEAR LONG TERM SUPPORT ABOVE INR 450 LEVEL. STOCK HAS FORMED BULLISH BAT FORMATION AT SAME SUPPORT LEVEL ON DAILY AND WEEKLY CHART. WHICH GIVES GREAT OPPORTUNITY TO BUYERS AT SUPPORT LEVEL WITH CONFIRMATION OF HARMONIC PATTERN. SINCE IT IS DAILY AND WEEKLY FORMATION TRADE CAN TAKE ABOUT 3-4 WEEKS TO EITHER HIT TARGET OR STOP LOSS.
BUY ENTRY: INR 490 (CAN BUY AT MARKET)
STOP LOSS: INR 398
TARGET-1: INR 595
TARGET-2: INR 683


AXIS BANK STRUCTURE BASED COUNTER TREND BUY OPPORTUNITYAXIS BANK STOCK IS TRADING IN DOWN TREND MAKING LOWER LOW LOWER HIGHS. AFTER MAKING IT'S LIFE TIME HIGH, STOCK TOOK LAST SUPPORT AROUND INR 760 LEVEL WHICH BECOMES RESISTANCE ONCE BROKEN TO DOWNSIDE ON 15-JULY-2019. THAT LEVEL OF INR 760 BECOMES STRONG RESISTANCE, WHICH STOCK TESTED SEVERAL TIME BETWEEN NOV-2019 TO FEBRUARY-2020.
NOW STOCK IS TRADING NEAR INR 625 LEVEL WHICH IS PAST SUPPORT MARKED BY GREEN BOX. WE CAN LOOK FOR COUNTER TREND BUY OPPORTUNITY IN LOWER TIME FRAME TO GO LONG WITH THE TARGET OF INR 695 TO INR 708 (RETEST OF PAST SUPPORT BROKEN ON 02-MARCH-2020). STOP LOSS SHOULD BE INR 10 BELOW LAST STRUCTURE HELD IN LOWER TIME FRAME.

Axis formed bullish bat on daily chartAxis bank formed bullish bat harmonic pattern on daily chart with PRZ 640-650
Target as per fibbo levels

AXIS BANK DailyBullish BAT
Price stopped at confluence of WEEKLY BAT BULLISH(Red colour Rectangle) + Daily BAT Zone
Volume lower than previous 2 candles with NO SUPPLY
POTENTIAL BUY

AXIS BANK WeeklyBullish BAT
Strong Resistance with confluence of Trend line & BAT Reversal zone
HIGH VOLUME Bars

AXISBANK WEEKLYBullish BAT
Strong Resistance with confluence of Trend line & BAT Reversal zone
HIGH VOLUME Bars

Axis bank shorting position - long tradeHello,
This is the positional shorting view on AXIS bank...
Chart image is self explained for the position.
Regards,
Satish Haryan

AXIS BANK BULLISH BAT BUY TRADESTOCK HAS BEEN ON SIDEWAYS SINCE NOVEMBER-2019. WHICH GIVES OPPORTUNITY TO TRADE HARMONIC PATTERNS.
BULLISH BAT
BUY ENTRY: INR 703
STOP LOSS: INR 687.10
TARGET-1: INR 723.45
TARGET-2: INR 737.65

