Axis Bank Ltd intraday level for 13th Aug #AXISBANK Axis Bank Ltd intraday level for 13th Aug #AXISBANK
Buying may witness above 1175
Support area 1160. Below ignoring buying momentum for intraday
Selling may witness below 1150
Resistance area 1160. Above ignoring selling momentum for intraday
Charts for Educational purposes only.
Please follow strict stop loss and risk reward if you follow the level.
Thanks,
V Trade Point
AXISBANK trade ideas

Axis Bank LtdAs mentioned in previous idea (ICICI bank), Axis Bank is also following the same pattern.

buy at zone - swing pickENTRY
- lines marked below is potential reversal zone ( PRZ)
- entry is strictly inside the zone
- look for buying confirmation in smaller time frame ( 15 minutes preferred )
EXIT
1. target
- mark fib retracement from C to latest swing low
- TGT 1 - 0.236 fib level
- TGT 2 - 0.382 fib level
- TGT 3 - 0.5 fib level ( preferred target )
2. SL
- candle close below (PRZ)
- if u didn't get confirmation inside the zone , ignore this pick
- if candle close is below zone , this pattern becomes invalid . IGNORE THIS PICK
- RE-ENTRY can be done , if u again get buying confirmation inside the zone

Axis bank - Harmonic patternIn 4H timeframe,
Harmonic shark pattern.
Price near reversal zone.
Price near demand zone

Axis Bank may touch 1200 level again tomorrowThere has been a lot of decline in Axis Bank today, but in the coming session tomorrow, a good rise can be seen in Axis Bank again. After gap down, there will be a boom which can be around 2 percent to 04 percent.

AXIS BANK S/R for 15/7/24Support and Resistance Levels: In technical analysis, support and resistance levels are significant price levels where buying or selling interest tends to be strong. They are identified based on previous price levels where the price has shown a tendency to reverse or find support.
Support levels are represented by the green line and green shade, indicating areas where buying interest may emerge to prevent further price decline.
Resistance levels are represented by the red line and red shade, indicating areas where selling pressure may arise to prevent further price increases. Traders often consider these levels as potential buying or selling opportunities.
Breakouts: Breakouts occur when the price convincingly moves above a resistance level (red shade) or below a support level (green shade). A bullish breakout above resistance suggests the potential for further price increases, while a bearish breakout below support suggests the potential for further price declines. Traders pay attention to these breakout signals as they may indicate the start of a new trend or significant price movement.
20 EMA: The yellow line denotes 20 EMA, to interpret the 20 EMA, you need to compare it with the prevailing stock price. If the stock price is below the 20 EMA, it signals a possible downtrend. But if the stock price is above the 20 EMA, it signals a possible uptrend.
Disclosure: I am not SEBI registered. The information provided here is for learning purposes only and should not be interpreted as financial advice. It is important to consult with a qualified financial advisor before making any investment decisions. Tweets neither advice nor endorsement.

AXIS BANK S/R Support and Resistance Levels: In technical analysis, support and resistance levels are significant price levels where buying or selling interest tends to be strong. They are identified based on previous price levels where the price has shown a tendency to reverse or find support.
Support levels are represented by the green line and green shade, indicating areas where buying interest may emerge to prevent further price decline.
Resistance levels are represented by the red line and red shade, indicating areas where selling pressure may arise to prevent further price increases. Traders often consider these levels as potential buying or selling opportunities.
Breakouts: Breakouts occur when the price convincingly moves above a resistance level (red shade) or below a support level (green shade). A bullish breakout above resistance suggests the potential for further price increases, while a bearish breakout below support suggests the potential for further price declines. Traders pay attention to these breakout signals as they may indicate the start of a new trend or significant price movement.
Disclosure: I am not SEBI registered. The information provided here is for learning purposes only and should not be interpreted as financial advice. It is important to consult with a qualified financial advisor before making any investment decisions. Tweets neither advice nor endorsement.

Axis Bank Limited Intraday level for today #AXISBANK Axis Bank Limited Intraday level for today #AXISBANK
For short time frame high chance to form a Inverse flag if break 410
Buying opportunity above 1205
Stop Loss area 1193
Selling opportunity below 1179
Stop Loss area 1193
Charts for Educational purposes only.
Please follow strict stop loss and risk reward if you follow the level.
Thanks,
V Trade Point

Axis Bank - Ready for next life time highThis stock trades with steady volumes on the bourses in all time frames.
Similarly, it is in the oversold zones of oscillators in average time frames.
The 52W H/L being INR 1,151.85 / 814.25
It is consistently making Higher Highs and Higher Lows.
It is standing around its support level in a rising channel.
LTP on NSE on 06/Feb/2024 was INR 1,053/- (with a high of INR 1,096.20)
It has already reached its demand zone and conservatively even if it falls from the current level to INR 1,000, it will be a good buy INR wherefrom it bounced back to reach its lifetime high.
After all this discussion, I believe the target price should be INR 1,300-1,400.
Stop Loss should be INR 900
Risk to Reward will be 1:4
The time horizon should be 9-12 months

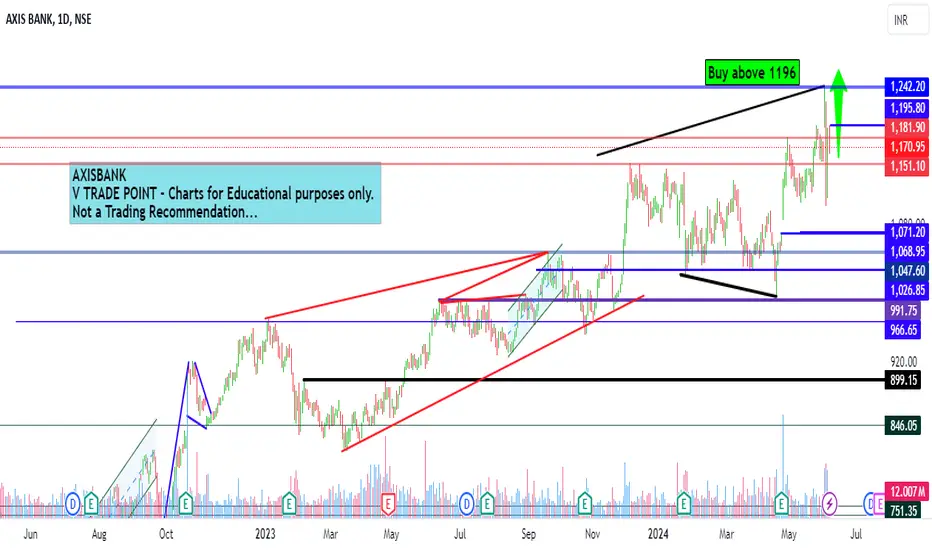
Axis Bank Intraday level for today #AXISBANK Axis Bank Intraday level for today #AXISBANK
Buying opportunity above 1196
Stop Loss area 1182
Charts for Educational purposes only.
Please follow strict stop loss and risk reward if you follow the level.
Thanks,
V Trade Point
Axis Bank Intraday level for today #AXISBANK Axis Bank Intraday level for today #AXISBANK
Buying opportunity above 1196
Stop Loss area 1180-1182
Charts for Educational purposes only.
Please follow strict stop loss and risk reward if you follow the level.
Thanks,
V Trade Point


Level for Axis Bank for 31st May #AXISBANK Level for Axis Bank for 31st May #AXISBANK
Buying opportunity above 1175
Support area 1150
Charts for Educational purposes only.
Please follow strict Risk Reward and Stop Loss if you follow the levels.
Thanks,
V Trade Point

Axis Bank (ticker: AXISBANK) ForecastThe chart provided is a daily candlestick chart for Axis Bank (ticker: AXISBANK) on the National Stock Exchange (NSE). Here is a detailed analysis and summary of the chart:
Timeframe and Data:
- Timeframe: Daily
- Data Range: From around September 2023 to mid-2024
Price Analysis:
- Current Price: ₹1,174.00
- Price Movement: The stock has shown notable price movements over the period.
- The price had a significant rally from around ₹900 in October 2023 to a high near ₹1,225 in early 2024.
- Post the high, the stock has been in a consolidation phase with a downward trend, forming lower highs and lows.
Technical Patterns and Indicators:
- Descending Channel: The stock price has been moving within a descending channel from the high in early 2024.
- Upper Trendline Resistance: Around ₹1,182
- Lower Trendline Support: Around ₹1,106
- Fibonacci Retracement Level: Applied from the recent swing high to low.
- 0.618 Level: ₹1,152.90
- 0.5 Level: ₹1,143.90
- 1 Level: ₹1,182.05
Key Levels and Future Projections:
- Resistance Levels:
- Immediate Resistance: ₹1,182.05, which aligns with the upper trendline of the descending channel and Fibonacci level.
- Major Resistance: ₹1,228.80, which is close to the previous high.
- Support Levels:
- Immediate Support: Around ₹1,143.90 to ₹1,152.90 (Fibonacci levels).
- Major Support: Around ₹1,106, aligning with the lower trendline of the descending channel.
Trade Setup:
- Bullish Scenario: If the price breaks above the immediate resistance at ₹1,182.05 and sustains above this level, it could potentially move towards the major resistance at ₹1,228.80.
- Bearish Scenario: If the price fails to break above the immediate resistance and moves below the Fibonacci support levels (₹1,143.90 - ₹1,152.90), it might test the lower trendline support around ₹1,106.
Conclusion:
The chart for Axis Bank shows the stock in a consolidation phase within a descending channel following a strong rally. Key levels to watch include the immediate resistance at ₹1,182.05 and the Fibonacci support levels. A breakout above ₹1,182.05 could signal a bullish move towards ₹1,228.80. Conversely, failure to break this resistance and a move below the Fibonacci support levels could indicate a bearish trend towards ₹1,106. Traders should look for a confirmed breakout in either direction to make trading decisions.

AXIS BANK S/R Support and Resistance Levels: In technical analysis, support and resistance levels are significant price levels where buying or selling interest tends to be strong. They are identified based on previous price levels where the price has shown a tendency to reverse or find support.
Support levels are represented by the green line and green shade, indicating areas where buying interest may emerge to prevent further price decline.
Resistance levels are represented by the red line and red shade, indicating areas where selling pressure may arise to prevent further price increases. Traders often consider these levels as potential buying or selling opportunities.
Breakouts: Breakouts occur when the price convincingly moves above a resistance level (red shade) or below a support level (green shade). A bullish breakout above resistance suggests the potential for further price increases, while a bearish breakout below support suggests the potential for further price declines. Traders pay attention to these breakout signals as they may indicate the start of a new trend or significant price movement.
Disclosure: I am not SEBI registered. The information provided here is for learning purposes only and should not be interpreted as financial advice. It is important to consult with a qualified financial advisor before making any investment decisions. Tweets neither advice nor endorsement.

AXISBANK (Axis Bank Limited) - Swing TradeClosing Price: ₹1,165.25
Change %: 3.49%
Volume: 12,818,081
High: ₹1,169.65
Axis Bank has shown an impressive gain of 3.49%, reaching a high of ₹1,169.65. The substantial volume reinforces the bullish trend, indicating strong buying pressure. Such a breakout performance often precedes further price appreciation, making AXISBANK a strong candidate for a swing trade.
Kindly conduct thorough analysis and consider market conditions before making any trading decisions.

Axis Bank swing to positional Axis Bank might give a good swing or positional trade with a decent stoploss and good Targets
ENTRY - 1140
STOPLOSS -1130
TARGETS - 1175,1200++
AXISBANK: BULLISH BREAKOUT AND POTENTIAL REVERSAL PATTERNAXISBANK has broken out bullish from a bearish channel, suggesting a potential rally ahead. Additionally, there's a chance of an inverted head and shoulders pattern forming. However, confirmation of this pattern requires waiting for a bullish breakout at the key level.

AXISBANK - 5 months CHANNEL══════════════════════════════
Since 2014, my markets approach is to spot
trading opportunities based solely on the
development of
CLASSICAL CHART PATTERNS
🤝Let’s learn and grow together 🤝
══════════════════════════════
Hello Traders ✌
After a careful consideration I came to the conclusion that:
- it is crucial to be quick in alerting you with all the opportunities I spot and often I don't post a good pattern because I don't have the opportunity to write down a proper didactical comment;
- since my parameters to identify a Classical Pattern and its scenario are very well defined, many of my comments were and would be redundant;
- the information that I think is important is very simple and can easily be understood just by looking at charts;
For these reasons and hoping to give you a better help, I decided to write comments only when something very specific or interesting shows up, otherwise all the information is shown on the chart.
Thank you all for your support
🔎🔎🔎 ALWAYS REMEMBER
"A pattern IS NOT a Pattern until the breakout is completed. Before that moment it is just a bunch of colorful candlesticks on a chart of your watchlist"
═════════════════════════════
⚠ DISCLAIMER ⚠
The content is The Art Of Charting's personal opinion and it is posted purely for educational purpose and therefore it must not be taken as a direct or indirect investing recommendations or advices. Any action taken upon these information is at your own risk.

Unlock Profitable Opportunities on AXIS Bank 15-Minute Chart!
Discover lucrative buy and sell signals on the AXIS Bank 15-minute chart with our expert Indicator Eagle Signal Pro v2. Our meticulously crafted indicator provides a roadmap to capitalize on short-term fluctuations in price, offering precise entry and exit points for maximum profitability. Whether you're a day trader seeking quick gains or an investor looking to optimize your short-term positions, our indicator delivers actionable opportunities to enhance your trading strategy. Join us as we decode the nuances of Indian Stock market trading movements and uncover the path to consistent profits in the dynamic world of trading.

Swing - Axis Bank Trend Breakout - Swing - Axis Bank Trend Breakout - 5% expected - what are you views?

Axis Bank Giving brekaout !!!Buy Axis Bank and hold for 1 months ... Giving fresh breakout for inverted head and shoulder

enter long above 738 or waitenter long above 738 or wait for 700-702 level to enter long with 686 as stoploss for a target of 738----759------770---------------------786
