axis bankaxis bank just breaks the support and can rise option can be buy with a good risk to reward
if you like such please contact me ,, we can work together i am a freasher
AXISBANK trade ideas

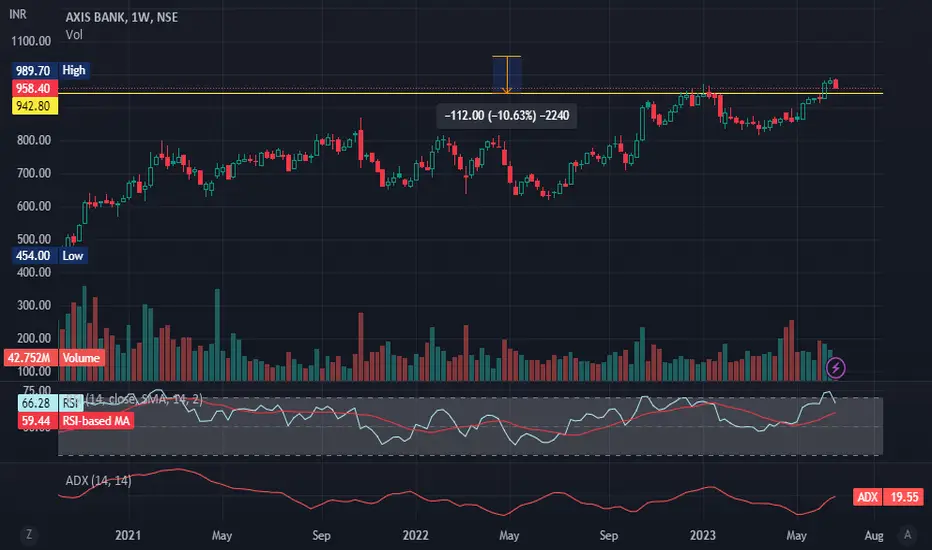
AxisbankAxisbank Chart Analysis.........29/06/23
Axisbank Short
Sl - 995 Closing basis
Target - 954 / 940
Enjoy !

Axis Bank near major area of value It's a 4h timeframe, analysis it on multiple timeframe at your own

AXIS BANK Axis bank at all time high if this stock consolidates at this price range. then it will have a gud target.

AXIS Bank LongAlthough it depends on the overall market condition still it is a good long-term trade as it is on a weekly frame.
The dotted green line is your target.
Put the stop loss according to your risk management.

Axis Bank As described in the chart levels, Axis is bouncing of from the 2nd accumulation zone.
50% position size is the correct way to go long from here.


Axis Bank_07.06.2023Breakout zone approached. Still Volumes doesnt represent breakout. For educational purpose only.

AXIS BANK (D)- BREAKOUT STOCK- AXIS BANK (D)
- Price approaching its ATH after retesting its BO level

AXISBANK--Outlook from 950-830 ??AXIS Bank Outlook::
Strong Supply zone is observed @950 zone
and Strong demand zone is observed @830 zone, keep on sell side from 950 and Buy side from 830-840 zone.
Price is going to enter in consolidation zone...between these 2 levels.
Short Term Bearish view::
950-830 levels..
1st phase Bearish::
from 950-900 is possible..
1st Phase::
Bullish view from 900-930 is also possible::
2nd Phase:: Bearish look
930 level to 860 levels.
3rd phase Bearish look::
910-900 to 830 levels.
3 Phase Bullish From::
860-910 level or 860-900 is possible.
4th phase Bullish from::
830 level to 950+ level..

AXISBANK--Bearish view??Observations::
After a strong fall price is not able to break the previous high,
if price breaks low, price fall is observed up to 900 and 895 levels.
previous resistance may again trying to push the price up, if it fails, it falls more.
keep track axis bank for short side.

Bank Nifty levels and analysis of Banking stocks Hello friends,
Levels of Bank nifty and some of major banking stocks for monday.

AXISBANK--Breakout Range (Supply)??Observations::
In my last view about AXISBANK, broken the trendline and continue fall or rise happens.
Now clearly the rise happens from these levels 870.
Resistance @ 935-940 range.
now The stock price is at Supply zone, price is in range from last 1 week, it will not test the supply zone.
consolidation to fake breakout may happens at this level, keep watch this level.
If price breaks 910 range, observe some fall price reach to 850-860 range.
We have a great support lies in the range 850-860 range.

BUY AXISBANK AROUND 665 TGT 725/780/830 SL BELOW 570 AVG @ 620Currently holding above the 200 and 100 dma and looking to break the resistance line from next week. With the upcoming result session and budget in near sight, good momentum can be expected in the short term with above mentioned entry and exit

AXISBANK 1HR (22/5/2023)NSE:AXISBANK
Next upside target is 970 .
Hello traders ,
All important levels are drawn in the chart.Work with risk reward ratio. not taking a trade is also a trade.
A trade cant change anything keep in your mind,if you think one trade can change your life then you are doing gambling in the market.take calculated risk.

AXISBANK-Resumes Uptrend or Reversal???AXISBANK-Observations:
------>Stock trending upwards
-------> Broken Trendline retest is needed.
-------->If this is a false breakdown the trend will continue moving upwards again.
--------->we have a great supports build at 830-850 levels.
---------> Previous strong demand Zone may act as Resistance and pushes the price towards downside, careful at 905-910 range.
--------->keep on buyside we have a chance to enter long until it breaks 830-850 range.

AXISBANK - Major Resistance and Range Breakout, Potential TargetAXISBANK has recently experienced a major resistance and range breakout, with a support level at 877. The stock is currently at a retest level of 895-905, with possible targets at 940 and 965.
This stock is definitely one to keep on your radar as there is potential for further upward movement.

Long AXIS Bank above 875The Stock is being consolidating near the short term resistance, abve 875 stock may attempt to go 900+ while SL for this trade can be 856 on closing basis. stock also forming higher highs and higher lows

AXISBANK (3 APRIL 2023)NSE:AXISBANK
All important levels are drawn in the chart.Work with risk reward ratio. not taking a trade is also a trade.
A trade cant change anything keep in your mind,if you think one trade can change your life then you are doing gambling in the market.take calculated risk.
DISCLAIMER- We are not a SEBI registered advisor.this is only for educational purpose. before taking trade take advice from your financial advisor.We will not be responsible for your profit and loss.

AXIS BANK Long ViewNSE:AXISBANK AXIS Bank is at a good level to buy. You can start with small quantity and further increase quantity after a bullish confirmation.
The only downside is the volumes, they are indicating a short position, please trade with proper risk management
This is not a buy/sell advice, do your own analysis and consult your financial advisor before investing in stock market


AxisBankAxis Bank Making possible IHS
if this pattern holds true..
we can see some nice rally in coming days
Just a view
