BAJAJ FINANCE NEAR BUYING ZONEYou can buy Bajaj finance for a short-term target of 6400 with stop loss below 4500 or go for a long-term as a Fundamental strong company.
Follow me for more analysis like this
BAJFINANCE trade ideas
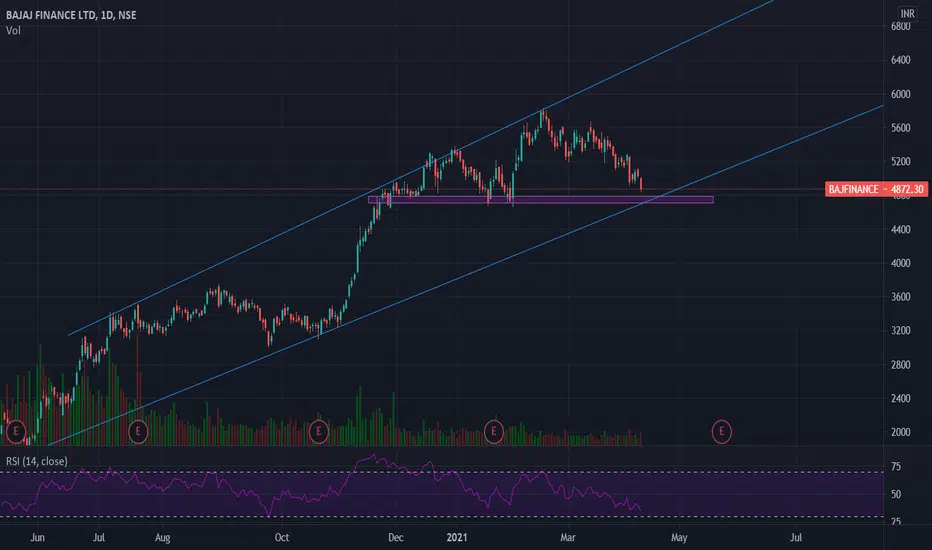
Bajaj finance !!!! Short postionGive breakout down side with good volume
We can expect a tgt of :- 4800
4680

Bajaj finance Little reversal to trendline 150 to 200 points up Trendline small trade for intraday or 3 days trade⬆️🔜❤️


BAJAJ FINANCE Intraday Analysis for 30th March 2021Hello Traders.
I am expecting a bearish momentum on bajaj Finance & I have also shared my analysis.
In this analysis once bajaj finance opens in flat one can enter sell position & it can help to achieve decent profits on today's market.
I have given clear SL , entry & Target 1 & Target 2.
Hope this will help in banking some profits if market moves in the favor.

BAJFINANCE intraday sell
Disclaimer
I am not sebi registered analyst
My studies are Educational purpose only
Please consult with your Financial advisor before trading or investing


Wealth maker bajaj financeAs you can see bajaj finance is on the support of
50 day Ema in 1h time frame if it breakout from it
Above resistance so we can see a big move but we have to ready for both up and down side
If it break it's 200 ema so it can reach its next support
This is just for learning purpose plz do your own research


BAJAJFINANCE - Elliott wave analysis - complex correctionIt is in WXY correction and ABC of Y wave is ON. Go short near 5530 with stop loss above 5670 for target around 5100 level.


bajfinance bajfinance formed a head and shoulder pattern which was broken and the broken support was retested and now going for the target

Bajaj finance Intraday can Buy Bajaj Finance
Stoploss 5299
Disclaimer
I am not sebi registered analyst
My studies are Educational purpose only
Consult with your Financial advisor before trading or investing


BAJAJFINANCE - Elliott wave analysis - H&S pattern It completed ABC zigzag cycle in 4 hr time frame from Covid low point. The H&S pattern created at the top as the part of correction down. Sell on bounce near neck line for target below 5000.
Plz give a like if you agree with EW count.

BAJAJ FINANCE LTD DAILY BUYwww.tradingview.com
CMP : 5780 TO 5800
SL ON CB : 5532
TARGET : 5862, 5976, 6137, 6343,
STRICTLY FOLLOW SL ON COLSING BASES.

ALERT : Support on 5350 . A Very powerful support on 5350 .
Make Your Positions on the basis of Price Action .

Bajaj Finance is likely to consolidate nowVery High RSI and ADX. Bajaj Finance is likely to consolidate now.


PullbackIt breached its weekly and daily resistance and now about to retest it support . Basically change of polarity
Buying can be done on retesting
