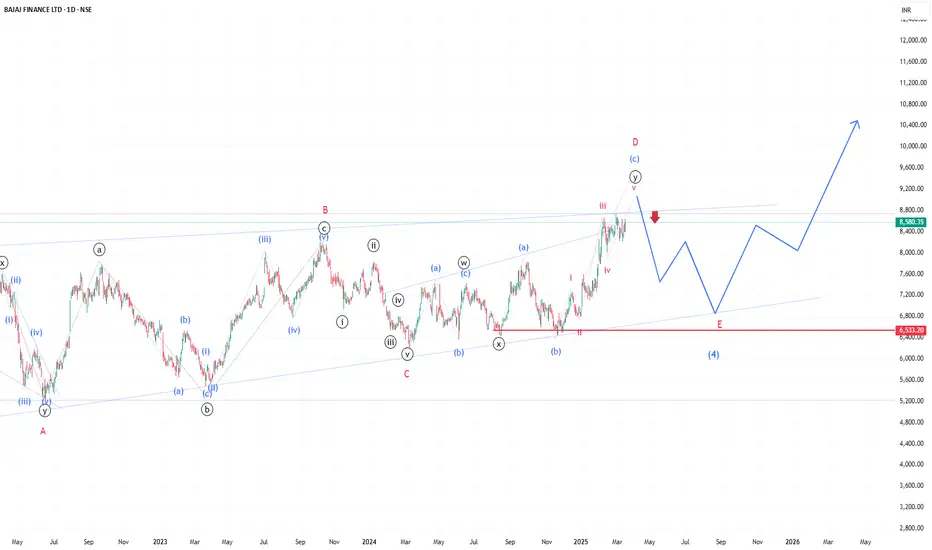
Bajaj Finance Elliott Wave Analysis – Triangle Before Next move? The daily chart of Bajaj Finance suggests an ongoing Elliott Wave triangle correction in Wave (4). Currently, the price appears to have completed Wave (d) near the upper trendline resistance, indicating a potential pullback towards the lower boundary (~₹6,533) to form Wave (e). If this structure holds, we could see a strong bullish breakout in Wave (5), targeting new highs.
🔹 Key Observations:
✅ Triangle Formation: Price action is consolidating within a contracting structure.
✅ Wave (d) Completion? Price has touched the upper boundary, signaling a possible correction.
✅ Wave (e) Drop? A move towards ₹6,533 would complete the correction before a bullish leg up.
✅ Upside Target: A breakout from the triangle could lead to a strong rally beyond ₹9,000.
🔹 Strategy:
📉 Short-term: Watching for a potential dip towards Wave (e) for a buying opportunity.
📈 Long-term: Bullish bias remains intact if the structure holds.
🚨 Disclaimer: This is my personal analysis, and I may be completely wrong. This is for educational purposes only and should not be considered financial advice. Please conduct your own research before making any trading decisions. I am not a SEBI-registered analyst.
BAJFINANCE trade ideas

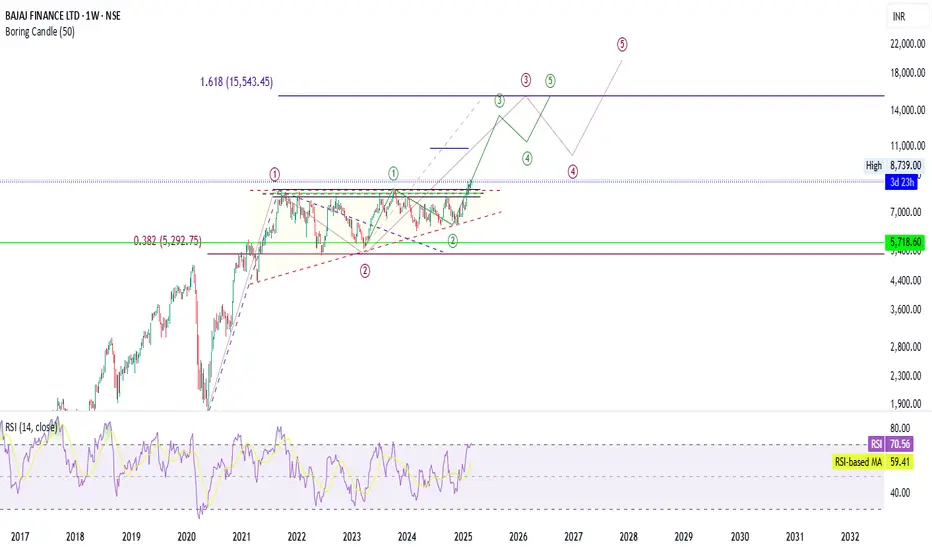
Analysis of Bajaj Finance Ltd (NSE) – Weekly ChartTechnical Summary:
Elliott Wave Structure:
The chart suggests an ongoing impulse wave (Wave 3 in green) after completing Wave 2 correction.
Future projections indicate the completion of Wave 5 around 15,543 as a 1.618 Fibonacci extension.
Support & Resistance Levels:
Strong Support:
5,718.60 (highlighted in green) – a crucial support area.
5,292.75 (Fibonacci 38.2% retracement) – historical support level.
Resistance:
8,739 (current high) – breaking above this could confirm a bullish continuation.
15,543 (Wave 5 target) – major long-term price target.
RSI Analysis:
RSI at 70.56, near overbought territory.
RSI-based moving average at 59.41, indicating strong momentum.
Key Observations & Potential Risks:
✅ Bullish Scenario:
If price sustains above 8,739, the next major move could lead towards 15,543.
Strong wave structure confirms long-term bullish potential.
❌ Bearish Risk:
If price fails to hold above 8,739, a correction toward 5,718 – 5,292 levels is possible.
RSI in overbought territory suggests a potential short-term pullback before further upward movement.
Recommendations & Strategy:
Monitor breakout confirmation above 8,739 for further upside.
Be cautious of a short-term pullback, especially if RSI starts declining.
Long-term investors can hold positions, while traders may wait for a retracement entry near 7,500 – 6,500.
BajajFinance AnalysisI have analyzed BajajFinance with short and targets are apples. I have used various Gann technique. I have used price action as well.

Bajaj FInance The stock is the strongest among the nifty 50 stocks. It is making newer highs; it broke the symmetrical triangle and has gone up on good volumes
Long term we can expect 12000 levels
short term 9200 cannot be ruled out.
A buy on dip strategy needs to be followed on this. A test of the triangle can be a buying opportunity.

Bajaj Finance - Complex Cup & HandleAmazing opportunity in an amazing business.
Bajaj Finance had broken out of a complex cup & handle pattern and have fallen since with the falling market.
The fundamentals in my views are ever strong and the financial performances are unparalleled.
The valuations are around the all-time low.
This isn't a buy call and should be considered as a source of learning to make technical and fundamental analysis in stock markets.

BAJFINANCE | SHORT | STBTBAJFINANCE is correcting from its Highs.
Stock is continuously forming Lower Highs and has broken the Weekly Pivots.
Short position can be taken for a Target to 8062 price level.
Overall Trend still remains intact.
This is a mean reversion set up.

Bajaj finance bearish butterfly pattern Bajaj finance bearish butterfly pattern cmp 8474 on 09.02.2025 it can fall from the marked level will see ..

Bajaj Finance Breaks All-Time High After 2+ Years: What’s Next.?Bajaj Finance has surpassed its previous all-time high of 8,080 rupees, fueled by robust buying activity amidst optimistic projections of rising consumer demand and a potential reduction in RBI interest rates. Traders may want to consider initiating a long position if the stock retests the 8,140 level. However, it is important to note that setting specific price targets may not be feasible at this time, as the stock is currently in a price discovery phase.

BAJFINANCE Sell Setup🔽BAJFINANCE Spot Sell Setup
Currently Trading At 8527 , Sell On Rise Around 8588 For The Target 7526
PRICE GET SQUARED AT 8588.70

Bajaj Finance Breaks Out of Multi-Year Channel!Bajaj Finance (BAJFINANCE) has finally broken out of a long-term consolidation channel on the upper side, signaling a potential bullish breakout. This breakout comes after more than three years of price action within a well-defined range.
🔎 Key Observations:
✅ Breakout Above Resistance: Price has decisively moved above the upper boundary of the channel.
✅ Strong Momentum: The breakout is supported by increasing volume, indicating strong buying interest.
✅ MACD Strength: The MACD indicator shows a strong bullish crossover, further supporting upward momentum.
🎯 Possible Targets:
Immediate resistance at ₹8,500+
Potential upside towards ₹9,000 – ₹9,500 in the coming months if momentum sustains.
⚠️ Risk Management:
Watch for retest of breakout level (~₹7,900 – ₹8,000) before entering.
Support levels around ₹7,500 – ₹7,200 in case of a pullback.
📊 Conclusion: The breakout from this long consolidation range suggests a fresh uptrend may be in play. Traders and investors should closely monitor price action for confirmation and volume follow-through. 🚀
🔔 What’s your take on Bajaj Finance’s breakout? Share your thoughts below! 👇

Bajaj finance breakout :)breakout above ascending triangle in monthly charts 📈
This stock is breaking out after 4 years of consolidation. Recent results were amazing. Over 4 years stock continue to grow earnings, while price stagnated as PE came down from 70x to 30x now. Here comes the lifetime breakout.

Bajaj FinanceMonthly Chart
3 Years resistance crossed
RSI Above 60 D / W / M
52 week / All time high crossed


BUY BAJAJ FINANCE Bajaj finance showing good strength from last week. Give positive breakout on upside with that upper side facing resistance. one can look to buy bajaj finance with ENTRY LEVEL OF 7000-7100 WITH TARGET OF 7500,7800 AND STOPLOSS 6700.

BAJAJ FINANCE SHORT TERM ANALYSIS Bajaj Finance is currently exhibiting promising performance on the charts, trading at 6465. We anticipate significant upside potential as it surpasses and maintains a position above 6700, potentially reaching 7800-8300. However, if it breaches 6257, it may test crucial short-covering levels, as outlined below:
1. - 5994
2. - 5701
3. - 5380

Next rise unlock A Long resistance is break after very long consolidation. With high Volume, volume around 1300 crore inr, volume and weekly breakout say down fall and consolidation is end. Now a new rise unlock.

BAJFINANCE | Buy Above 7810 with small SLDisclaimer:
This is not financial advice. Please do your own research or consult with a financial advisor before making any investment decisions. Investments in stocks can be risky and may result in loss of capital.

BAJAJ FINANCE LTD: Bullish Momentum and Key Trading InsightsBAJAJ FINANCE LTD is demonstrating robust bullish momentum with potential breakout opportunities. Traders and investors should consider key indicators and trend direction to inform their trading strategies.
Current Stock Price: ₹7,606.60
Key Levels:
• Swing High: ₹7,824
• Swing Low: ₹6,451
Trend Direction: UPTREND
Indicators in Focus
Bullish Momentum and Possible Breakout: The stock is currently exhibiting strong bullish momentum, indicating positive market sentiment. This is further supported by a possible breakout scenario, suggesting that the stock might surpass significant resistance levels and experience substantial upward price movement.
Swing Trade and Buy Today, Sell Tomorrow (BTST): Swing trading aims to capture gains from short-term price swings. This strategy is suitable for traders looking to capitalize on brief market movements. The BTST approach involves buying the stock today with the intention of selling it the next day for a profit, especially in a bullish market scenario.
RSI Breakout: The Relative Strength Index (RSI) levels indicate momentum shifts. Current levels show that the stock is in a healthy trading range without extreme overbought or oversold conditions.
Technical Indicators Analysis
Daily (D), Weekly (W), Monthly (M):
• Stochastic: High Stochastic values on the daily and weekly timeframes suggest that the stock is trading near its highest point in the trading range, indicating strong upward momentum and a bullish trend. On a monthly scale, the Stochastic value shows potential for a new upward swing, indicating room for further price appreciation.
• CCI (Commodity Channel Index): High CCI values indicate that the stock's price is significantly higher than its average price, suggesting strong buying pressure and market interest. On a monthly scale, the mixed CCI values indicate a combination of bullish momentum and potential consolidation, hinting at a balanced market sentiment.
• MACD (Moving Average Convergence Divergence): On the daily and weekly timeframes, a "Bull" indication aligns with the current uptrend, suggesting continued positive momentum. This reinforces the bullish sentiment and encourages investors to hold or buy the stock. However, mixed signals (Bull, Bear) on a monthly scale indicate potential long-term volatility, prompting investors to be cautious and consider risk management strategies.
Swing Points:
• Swing High: ₹7,824
• Possible Next Swing Point: ₹8,451
Volume Analysis
Volume Data:
• Current Volume: 2.48M
• SMA Volume: 1.12M
Current Volume vs. SMA Volume:
When the current volume of 2.48M is compared to the SMA volume of 1.12M, we see that the current trading activity is significantly higher than the average. This indicates a surge in trading interest and strong investor participation.
Impact on BAJAJ FINANCE LTD:
1. Increased Trading Activity: The high current volume suggests robust buying interest, potentially driving the stock price higher.
2. Confirmation of Bullish Momentum: The increased volume, along with bullish technical indicators, confirms the uptrend and signals further price appreciation.
3. Potential for Breakout: The significantly higher volume may lead to a breakout, with the stock breaking through key resistance levels and achieving substantial gains.
Conclusion and Strategy
Short-term (Swing Trade/BTST): With strong bullish momentum and potential breakout, the short-term strategy could focus on buying the stock at the current levels and targeting the next possible resistance levels (Swing High: ₹7,824 and ₹8,451).
Long-term: Given the bullish sentiment in daily and weekly indicators, investors might consider holding the stock for longer periods, monitoring the monthly MACD and CCI for trend shifts.
Risk Management: Use stop-loss orders to manage risk, particularly if the stock price nears key support levels or if bearish signals emerge in short-term indicators.
Caution : Please note that the company’s financial results are due to be announced tomorrow, 29 January 2025. This can lead to increased volatility in the stock price. Traders should exercise caution and consider the potential impact of the results on their trading strategies.

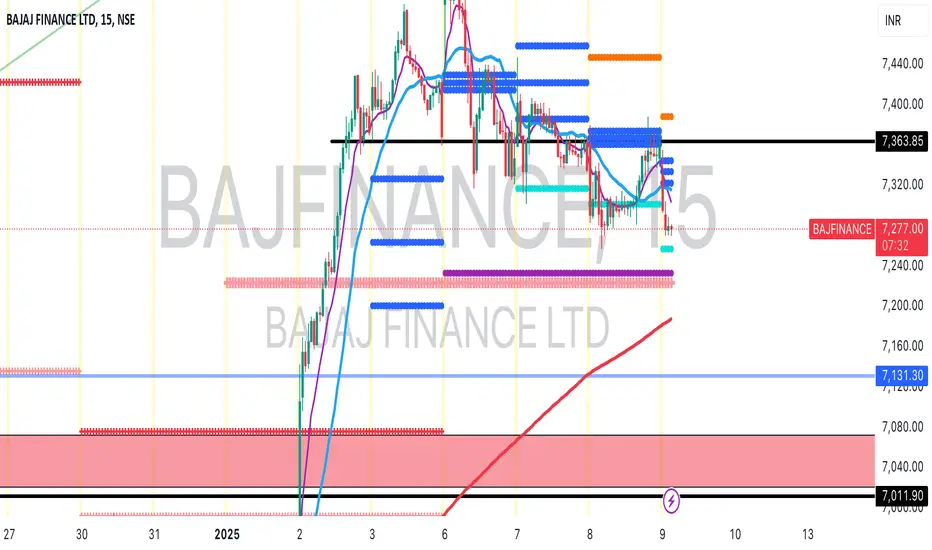
Analyzing BAJFINANCE: A Simple BreakdownOverview
The price action around the ₹7,440 resistance level tells an interesting story. Initially, the price broke above this key level with increased trading activity (volume), signaling strong buying interest. However, it couldn’t stay above ₹7,440 for long and fell back below the resistance in the following sessions. Despite this, the selling pressure was weak, as shown by the lower trading activity during the drop. This suggests that sellers weren’t very aggressive.
Signs of Buyer Strength
One important observation in the circled area is that the price has been forming higher lows. This means buyers are stepping in at slightly higher levels each time, showing they are still interested. The latest green candle, which has a noticeable increase in volume, further supports this idea. It indicates that buyers are regaining control and may attempt to push the price higher.
Was It a Failed Breakout or a Retest?
While the first attempt to break ₹7,440 failed, the price hasn’t fallen much. Instead, it seems to be consolidating in a range, with strong buyer support around ₹7,200–₹7,300. This could mean the price is preparing for another breakout attempt, making this a potential retest phase rather than a complete failure.
What to Watch for Next
The next big signal will come if the price closes above ₹7,440 with strong trading activity. This would confirm a successful breakout and could lead to further upward movement. Until then, traders might want to wait for clear confirmation to avoid getting caught in a false signal.
Study
The circled area highlights a battle between buyers and sellers. While the initial breakout failed, the price has shown resilience by holding above key support levels. If buyers continue to gain strength and push the price above ₹7,440, we could see a bullish trend emerge. Until that happens, patience is key.

Bajaj Finance upside seen for 10,000 Bajaj Finance Good For Long position now cmp. 7445 upside seen for 10,000

BAJAJ FINANCE LONGBAJAJ FINANCE
MTF Analysis
BAJAJ FINANCEYearly Demand 1,985.0
BAJAJ FINANCE 6 Month Demand 4,923.0
BAJAJ FINANCEQtrly Demand BUFL 6,249.0
BAJAJ FINANCEMonthly Demand 6,168.0
BAJAJ FINANCEWeekly Demand 6,448.0
BAJAJ FINANCEWeekly Demand 6,976.0
ENTRY -1 Long 6,976.0
SL 6,165.0
RISK 811.0
Target as per Entry 10,899.0
RR 4.8
Last High 8,192.0
Last Low 5,485.0
ENTRY -2 Long 6,448.0
SL 6,165.0
RISK 283.0
Target as per Entry 10,899.0
Last High 8,192.0
Last Low 5,485.0

BAJAJ FINANCE | SHORT | INTRADAYBAJAJ FINANCE is clearly struggling to sustain the price at higher levels.
Notice the continuous lower highs being formed which is a sign of weakness.
The Daily Pivot has also been rejected strongly in the first hour.
An intraday short trade can be initiated for a target to 7200 level.