BAJFINANCE trade ideas

BAJAJ FINANCEThe price has rallied up significantly in the past 3 sessions. A rounding bottom can be seen at the top of the trend further showing that a profit of Rs.30-40 can be booked if the market continues in an upward trend.
RESISTANCE LEVEL (2700-2710)
SUPPORT LEVEL (2660-2670)
If the price goes in a downtrend, wait for the pullback at the support level. RSI level is in the appropriate range but once it goes into the oversold range it can correct itself. Stop loss should be placed below the support level (2650-2655), away from the market structure
Thanks
P


Bajaj Finance - perfect entry level.Weak on charts, available at a good discount, a bright future for this stock. What else do you need? ;) NSE:BAJFINANCE

15mins Elliot counts15 mins count shows BF could push to 2750 and some retrace before going for a long....

Bajaj Finance - ElliotsElliots on BF - Small degree. Short term target looks 3200 as wave 3 should be longer one than any other waves. So counting wave 1 is 700 points.... counting this wave 3 should hit at least 3100 ~ 3300 range.

Support & ResistanceHey Guys, Please Support - Hit Like.
Financial sector will be weaker in near term, Although if you remain stock specific you can gain some short term benefit.
Here is an example of Bajaj Finance Ltd. One of the leading NBFCs. Price has break upper band of the Wedge pattern and RSI + MACD is giving Bullish indications.
When ever The price has come to the Demand zone it has shown Bullish reversal. I have Analyse Short term Up and Down Side. With RSI showing strength near term looks bullish and Targets can be achievable. But should exit before price reaches to the ultimate strong resistance from the past. There is not much to loose for an investor although price moves a little down because demand zone has prove that there will be a reversal at the level shown on the chart. Low Risk High return.
Thanks.

BAJAJ FINANCE TECHNICAL ANALYSISOnly trade when you understand the concepts.
Also note,
Negative divergence on 5 mins chart on MACD.
Negative divergence on 15 mins chart on RSI.
Negative divergence on 1 hour chart on RSI. Shooting star on 1 hour chart.


LONG TRADE - BAJAJ FINANCEBajaj Finance Ltd = Buy Above 2505 , For level 3010 - 3050 , keeping support @ 2225
Risk :Reward = 1:2
** This post is for educational purpose only. Kindly concern with your advisor before investing in market-related instrument. **


Bajaj finance chart for longterm investmentOverall its in buy .............but present situation is sell in weekly chart.Its a Automated chart Which will show you the analysis easly!!!!
# Try shanky buy sell signal Indicator and see the result.

Buy The Dip Mode again ....
First target 3030 may pull back to 2414 if you fancy your luck at intra day , however following up to the earlier HTF graph
2793 is probably around where we pull back from our rejection of 3030 .
From there i recon its full power ahead as we smash the 200 day and make for 3460.
on a side note :
good is the enemy of the great ???? what does their motto mean ???

Love that Monthly March Candle ! BTFDEach graph to me is a story with the March candle i could just imagine how many people got screwed over and must be cursing ever having bought into BF .
The question i ask myself is why do people not actively manage their portfolios and use stop losses?
Any ways this just tested 2548 resistance perfectly and now looking to flip it and go for 3030 .
In my opinion this would be a good spot to load up for the long term although i stay away from long term commitments :)
The 50 day acted as support and it bounced perfectly now attempting to break the 99 and 200 , i feel 3030 is where we the 99 day comes into play hence first rejection about there ,
Will post a LTF graph so its easier to understand.

Bajaj finance Intraday Trade setup for 15th juneHello everyone,
Bajaj finance is in a good place and the right script for Monday trade setup. set alert on these levels and add it in your watch list for Monday trade setup.

Bajaj Finance - Uptrend???Bajaj finance - hidden bullish divergence and towards Wave 5 in hourly chart


BAJAJ FINANCE - SHORT POSITIONThe market will continue in a downtrend, thus short position should be acquired in this scenario.
Support Level 1 (2410-2420)
Support Level 2 (2360-2370)
Final Support (2280-2300)
If the first target is met, i.e. 2360, then place a trailing stop loss and aim for the next target (2290).
Thanks
P

Stock: BajFinanceStock: BajFinance
Looking Bearish now. It was reacted at 23.6 Fibo Level
If Break 2415, Expect Further Downside with above marked targets 2259,2078,2000--
Dedicated to: Darshil

BAJAJ FINANCETHE STOCK SEEMS TO BE IN UPTREND FOR SHORT TERM , THE RESISTANCE NOW IS AT 2554 , IF CROSSED 2554 AND SUSTAINS WE CAN SEE THE RETEST OF VPOC AROUND 2714 LEVELS , ON SHORT SIDE IF PRICE SLIDES BELOW 2310 LEVELS WE CAN BUY ON RETEST ON SHORT SIDE WITH TARGET OF 2245 , OVERALL NIFTY SEEMS TO BE IN SHORT TERM UPTREND EVEN GLOBAL CLUES ARE POSITIVE HENCE TO GO WITH TREND ON CAN SEE HOW THE PRICE REACTS TO 2554 LEVELS IF SUSTAINS 2714 LEVELS WOULD BE AN EASY TARGET , WE CAN WAIT TO BUY AT RETEST OF AROUND 2554 LEVELS WE SHOULD NOT BUY AS SOON AS PRICE CROSS 2554 BECAUSE ITS A MAJOR RESISTANCE AS PER PREVIOUS HIGH THERE WOULD BE A SELLING OR BOOKING OF PROFIT AS STOCK HAS GIVEN GOOD RUN IN PREVIOUS DAYS . ITS A BUY ONLY ABOVE 2554 LEVELS , SELL ONLY BELOW 2310 .
VIEWS AND SUGGESTIONS INVITED
THANKS

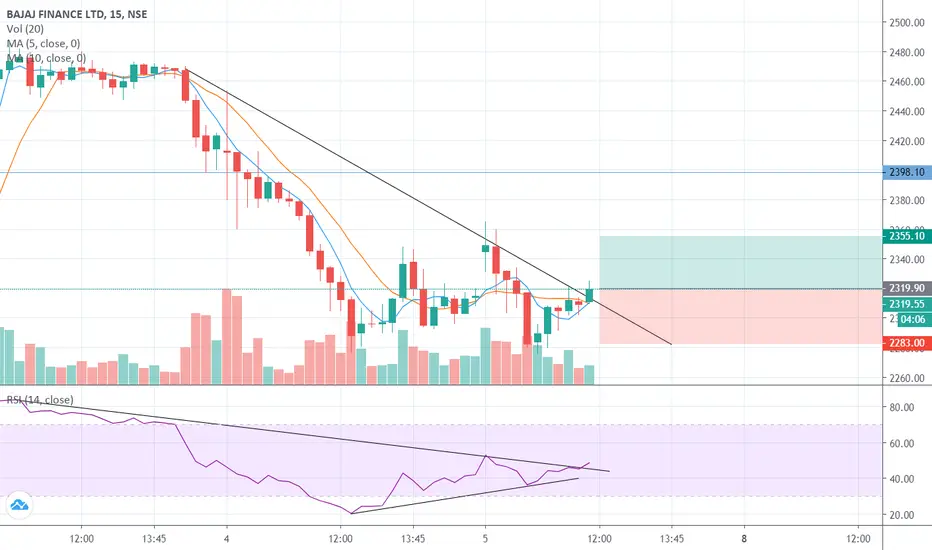
Bajaj Finance giving confirmation for buyFrom the 15 minute chart of Bajaj finance, we can see RSI is giving positive divergence, and it has confirmed the buying. Second, Trend line for buying is also breaking, which can be confirmed from next candle. Third, the 5 moving average is also crossing the 10 moving average, which also shows indication to buy. Fourth, Hieken Ashi charts has also showed buying.
I have marked the stop loss on the chart, and first target. After confirming you may buy the stock with your own study.
Class A bullish divergence in Bjaj FinanceClass A bullish divergence in Bjaj Finance
Falling Wedge breakout
Good time to go long

