Bajaj finance Looking good for long term
Wait for break trend line, entry after break trend line.
Chart setup in favour for long position.
Macd crossover
RSI in postitve zone
Disclaimer:- Only for educational purposes.
Not recommended for any side of trade.
BAJFINANCE trade ideas

Bajaj Finance down fall over ?It looks like down fall is over and its almost on the support may bounce back from the current level. According to Gyan fan targets are huge.

Bajaj Finance - Hidden Gem?Bajaj Finance is a company of the prestigious Bajaj group. It is the largest NBFC company of India. It has the lowest NPA among NBFC companies as the largest customer of the company is Bajaj Auto which is another group company of Bajaj Group. The company is continuously increasing its market share and onboarding new customers.
The P/E ratio of the company is at 27.33 which is very less than the 20 year median P/E of 45.6.
The company is constantly increasing its quarterly and yearly revenue and net profit.
The company has significantly decreased its Net NPA from 1.46% in June 2021 to 0.38% in June 2024 which shows the good performance of the company.
The ROE is 22.12% which is considered excellent for NBFC segment stocks.
Regardless of such extraordinary performance and financials the company is trading at the same levels at which it was trading 3 years ago. It is a golden opportunity to invest in this stock at this point of time for long term as it may go 3-4 times up from this level.
I am not a SEBI registered analyst.
Please do your own analysis before investing.
Do like and follow and share among your friends and family.
Thank you.

BAJAJ FINANCE 1WEEKwhat is the name of this pattern...??
Chart patterns, like head and shoulders or triangles, can indicate potential market movements. Recognizing these patterns helps traders make informed decisions and improve their trading strategies.
I Am Not SEBI Registered Analyst. All Post and Levels Posting is only for educational and knowledge purpose. I Am not responsible for your any kind of loss or profit.
No Claim, All Rights Reserved.‼️

Bajaj finance showing signs of inverted H&SNSE:BAJFINANCE could breakout H&S inverted on Daily. Take entry on confirmation ONLY.
Good risk:reward ratio if price action follows our technicals 🤞🏻


Bajfinance -Harmonic bat patternIn 4H Timeframe,
Price hits reversal zone .
Price near daily demand zone.
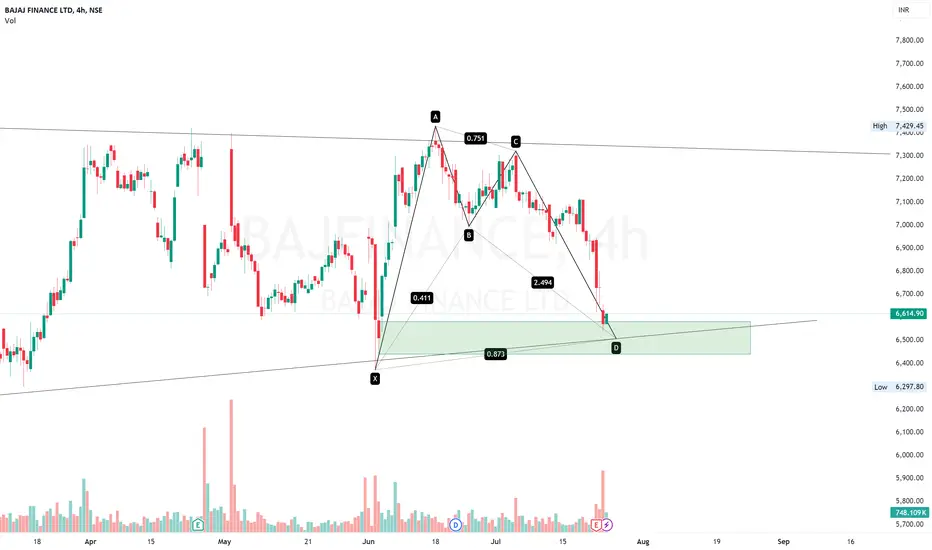
buy at zone - swing pickENTRY
- lines marked below is potential reversal zone ( PRZ)
- entry is strictly inside the zone
- look for buying confirmation in smaller time frame ( 15 minutes preferred )
EXIT
1. target
- mark fib retracement from C to latest swing low
- TGT 1 - 0.236 fib level
- TGT 2 - 0.382 fib level
- TGT 3 - 0.5 fib level ( preferred target )
2. SL
- candle close below (PRZ)
- if u didn't get confirmation inside the zone , ignore this pick
- if candle close is below zone , this pattern becomes invalid . IGNORE THIS PICK
- RE-ENTRY can be done , if u again get buying confirmation inside the zone

Bajaj FinBajaj Fin Cmp 6928
Looking at that chart,
I see a ABCDE sideways correction in it..
after which it has made wave 1 and 2...
now 3.1 and 3.2 has done...
if 6900 holds...
we can see it moving towards 7600/8450+ levels
Just a View!!
Vedang:)
Disclaimer: chart is for study purpose only!!!

Excellent Opportunity in BAJA FinanceBuy ZONE - STOP LOSS marked in the chart.
Excellent BUY opportunity in Bajaj Finance for the long term.
Risk: 1% of portfolio

BAJAJ FINANCE at Importnat Support | Testing breakout lineBAJAJ FINANCE at Importnat Support | Testing breakout line
above 6929 - 7291/7551/7742
7291/7300 will be support for New High 8300/9800

Review and plan for 5th July 2024Nifty future and banknifty future analysis and intraday plan in kannada.
This video is for information/education purpose only. you are 100% responsible for any actions you take by reading/viewing this post.
please consult your financial advisor before taking any action.
----Vinaykumar hiremath, CMT

BAJAJFIN-LONGSharing my bullish outlook based on BAJAJFINANCE. Would love to hear your thoughts and insights on this setup.

BAJAJ FINANCE TREND IS UP The Price Is declined with increase of Volume Indicates stock has accumulated well soon a strong bullish is expected. The maximum fall can happen is 6700, the current price also promising to buy. The Stock Has not moved Much From last 2-3 years expecting 10K in the Near future. Best time to accumulate.

Bajfinance Intraday Levels: 24-Jun-24Stock closed nearly at support Zone
Bearish <7050
Bullish > 7150
Wait for proper rejections at mentioned Zone for better result add your strategy or indicator

BAJAJ FINANCE - At Important LevelBAJAJ FINANCE at Important Levels both move possible based on market mood. 7800 upside or else 6500 lower side.

BajfinanceHello Traders Bajfinance has longe side view looks like cup and handle pattren good risk reward hope its usefull...

BAJFINANCEAm not a stock adviser, just sharing my view.
This is point seems crucial for this stock, good invest a small portion for short term, with 5% Stop and can except 10 to 12%.
Very good break.
if you get benefited, then please feed a poor.


Bajaj Finance : make it or Break It !- The chart is pretty self-explanatory.
- If you look at the PE, It has come down substantially from about 100.
- The crucial resistance zone is an important obstacle. A break and sustenance above it could mean further upmove.
- Invest with caution as Investors are getting greedy post the bull run.
What are your thoughts? Leave us a comment.
Disclaimer: Please note that we are not regi stered advisors and the views expressed here are solely personal opinions. We strongly recommend consulting with your financial advisors before making any investment decisions. We like everybody else, have the right to be wrong.:)

Bajaj FinanceGood news from RBI (lifting some sanctions) last week.
But Higher levels saw profit booking...
Have marked important Reversal for the Month of May.
Happy Trading....

Bajaj finance is ready to flyBajaj finance can double from here with in a year. Sl below the trend line.
Chart is self explanatory. Please follow the price action & take the trade as per your appetite.
The information provided here is only for educational purpose. The information provided here is not intended to be any kind of financial advice, investment advice, and trading advice. Investment in stock market is very risky and trading stocks, options and other securities involve risk. The risk of loss in stock market can be substantial. Moreover, I am not a SEBI registered analyst, so before taking any decision or before investing in any Share consult your financial advisor and also do your analysis and research.
Request your support and engagement by liking and commenting & follow to provide encouragement.
